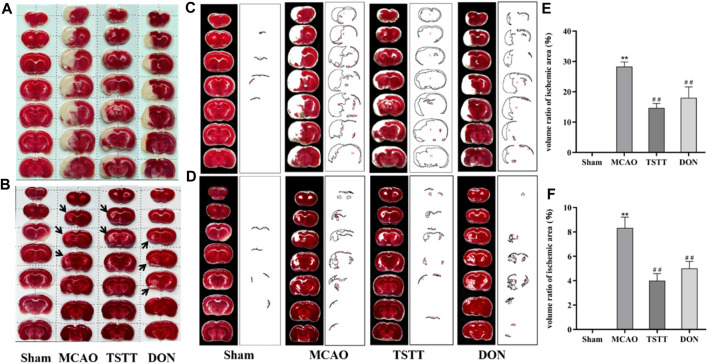
FIGURE 2.
TTC staining and statistical results of brain tissue in rats from each group. (A) TTC staining after intragastric administration for 7 days. (B) TTC staining after intragastric administration for 28 days. (C) Quantification of the ischemic volume after intragastric administration for 7 days. (D) Quantification of the ischemic volume after intragastric administration for 28 days. (E) Comparison of the ischemic volume after 7 days of intragastric administration. (F) Comparison of the ischemic volume after 28 days of intragastric administration. ** p < 0.01 vs. Sham group; ## p < 0.01 vs. MCAO group; n = 3.

