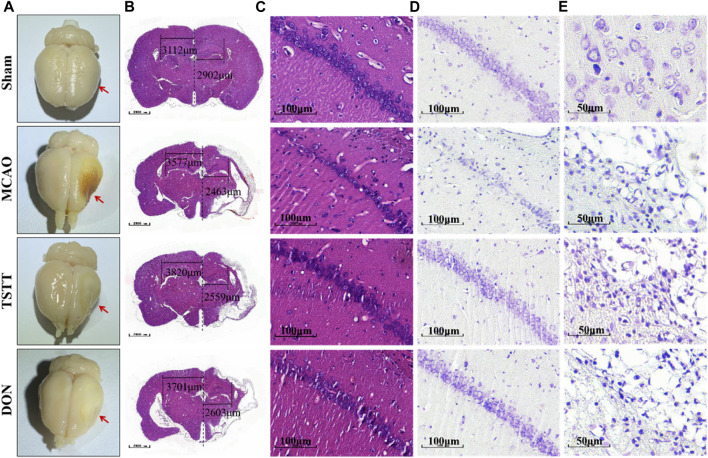
FIGURE 3.
HE and Nissl staining after brain tissue perfusion in each group:(A) Representative map of brain tissue perfusion in each group. (B) HE staining of whole brain tissue; Scale bar = 1,000 μm. (C) HE staining of the hippocampal CA1 region; scale bar = 100 μm. (D) Nissl staining of the hippocampal CA1 region a; scale bar = 100 μm. (E) Nissl staining in the cortex and ischemic penumbra; scale bar = 50 μm.

