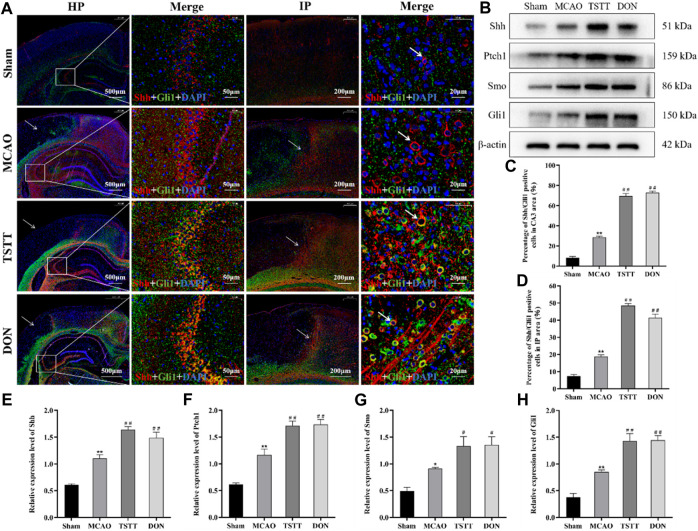
FIGURE 6.
TSTT promoted Shh/Gli1 co-localization in the hippocampal CA3 region and ischemic penumbra in PSCI rats. (A) Shh/Gli1 co-localization staining in the hippocampal CA3 region and ischemic penumbra, HP: scale bar = 500 μm; HP-Merge: scale bar = 50 μm; IP: scale bar = 200 μm; IP-Merge: 20 μm. (B) Expression of Shh, Ptch1, Smo, and Gli1 proteins in the hippocampus. (C) Population of Shh/Gli1-positive co-localization positive cells in the hippocampal CA3 area. (D) Population of Shh/Gli1-positive co-localization cells in the hippocampal IP area. (E) Relative expression of Shh. (F) Relative expression of Ptch1. (G) Relative expression of Smo. (H) Relative expression of Gli1. * p < 0.05 or ** p < 0.01 vs. Sham group; # p < 0.05 or ## p < 0.01 vs. MCAO group; n = 3.

