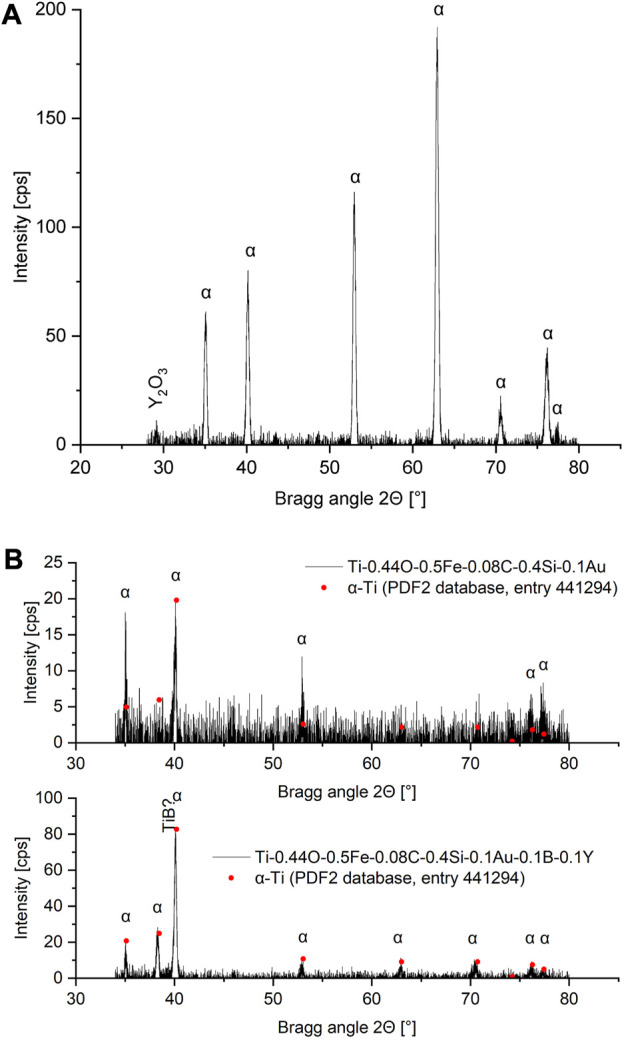
FIGURE 12.

Diffraction results obtained for three studied alloys with assigned phases. (A) Ti-0.44O-0.5Fe-0.08C-0.4Si-0.1Au-1.0Y. (B) Comparison of Ti-0.44O-0.5Fe-0.08C-0.4Si-0.1Au (base alloy) with Ti-0.44O-0.5Fe-0.08C-0.4Si-0.1Au-0.1B-0.1Y. Included are peak positions and rescaled intensities for pure α-titanium, obtained from the PDF2 database.
