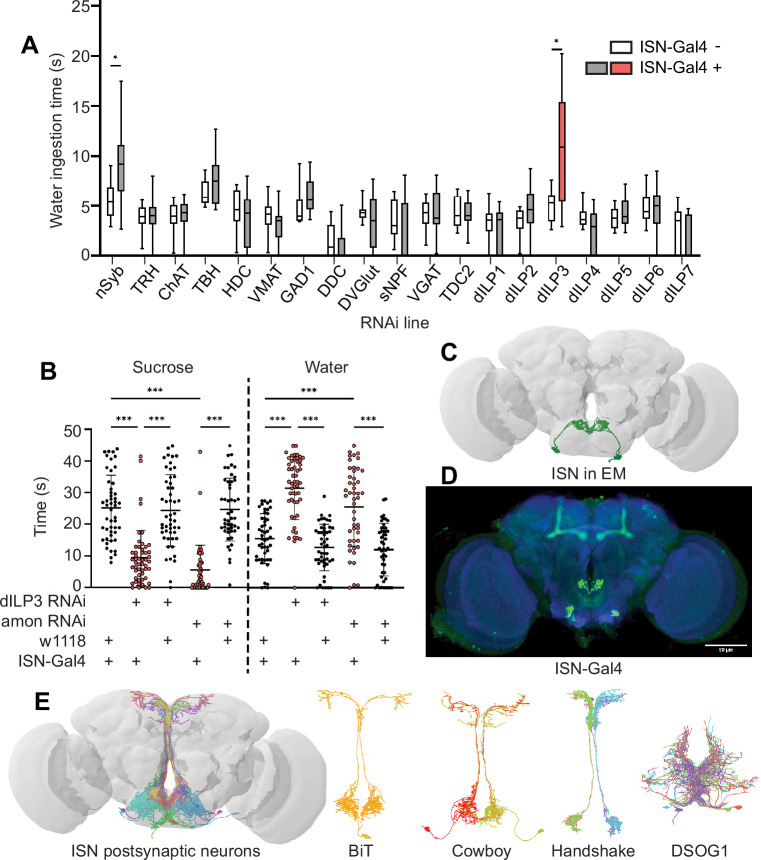
Figure 1. Interoceptive subesophageal zone neurons (ISNs) relay information to the pars intercerebralis.
(A) Temporal consumption assay screen for water ingestion using RNAi targeting different neurotransmitter pathways. UAS-RNAi+ or - ISN-Gal4. RNAi against: nSynaptobrevin (nSyb), tryptophan hydroxylase (TRH), choline acetyltransferase (ChAT), tyrosine beta-hydroxylase (TBH), histamine decarboxylase (HDC), vesicular monoamine transporter (VMAT), glutamic acid decarboxylase 1 (GAD1), dopa decarboxylase (DDC), Drosophila vesicular glutamate transporter (DVGlut), short neuropeptide F (sNPF), vesicular GABA transporter (VGAT), tyrosine decarboxylase 2 (TDC2), Drosophila insulin-like peptide 1 (dILP1), Drosophila insulin-like peptide 2 (dILP2), Drosophila insulin-like peptide 3 (dILP3), Drosophila insulin-like peptide 4 (dILP4), Drosophila insulin-like peptide 5 (dILP5), Drosophila insulin-like peptide 6 (dILP6), Drosophila insulin-like peptide 7 (dILP7). Represented are the mean, and the 10–90 percentile; data was analyzed using Kruskal-Wallis test, followed by multiple comparisons against the RNAi control; p-values were adjusted using false discovery rate. n=8–39 animals/genotype except nSyb positive control (70–72). (B) Temporal consumption assay for 1 M sucrose or water using RNAi targeting dILP3 or amontillado in ISNs. Sucrose assay: Kruskal-Wallis test followed by Dunn’s multiple comparison tests against ISN control and respective RNAi control. Water assay: ANOVA, Šídák’s multiple comparison test to ISN control and respective RNAi control. n=48–52 animals/genotype. (C) ISNs reconstruction from full adult fly brain (FAFB) volume. (D) Light microscopy image of ISN-Gal4 registered to JFRC2010. (E) ISN postsynaptic neurons based on synapse predictions using FAFB volume (Zheng et al., 2018) and connectome annotation versioning engine (CAVE, Buhmann et al., 2021; Ida et al., 2012). Left: 10 postsynaptic neurons, right: postsynaptic neurons bilateral T-shaped neuron (BiT), Cowboy, Handshake, and DSOG1. *p<0.05, ***p<0.001.


