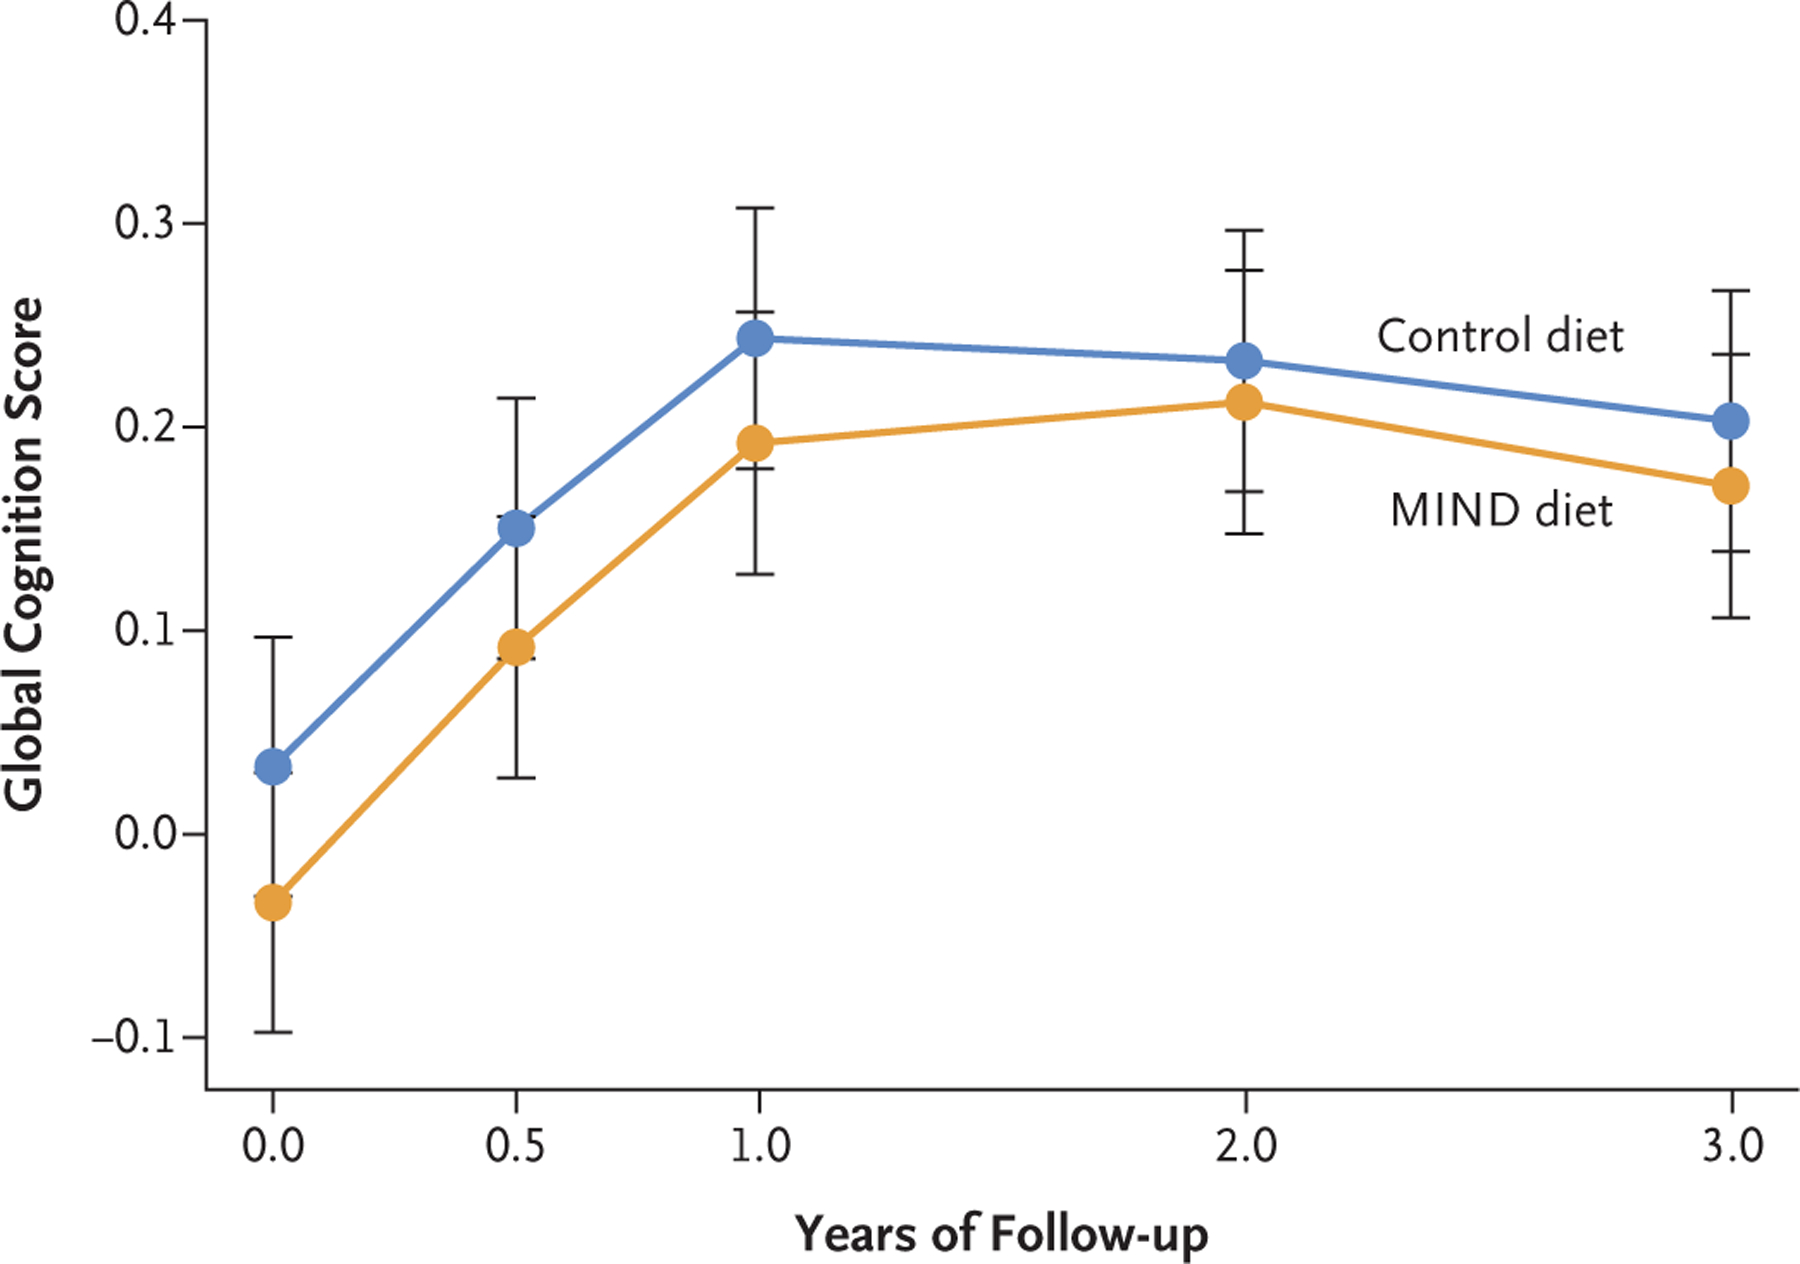
Figure 2. Changes in the Global Cognition Score during the Trial Period.

Shown are the mean global cognition scores over 3 years from a linear mixed-effect model; I bars indicate 95% confidence intervals. The global cognition score was derived from a 12-test battery. The raw scores from each test were converted to z scores, which were averaged across all tests to create the global cognition score; higher scores indicate better cognitive performance.
