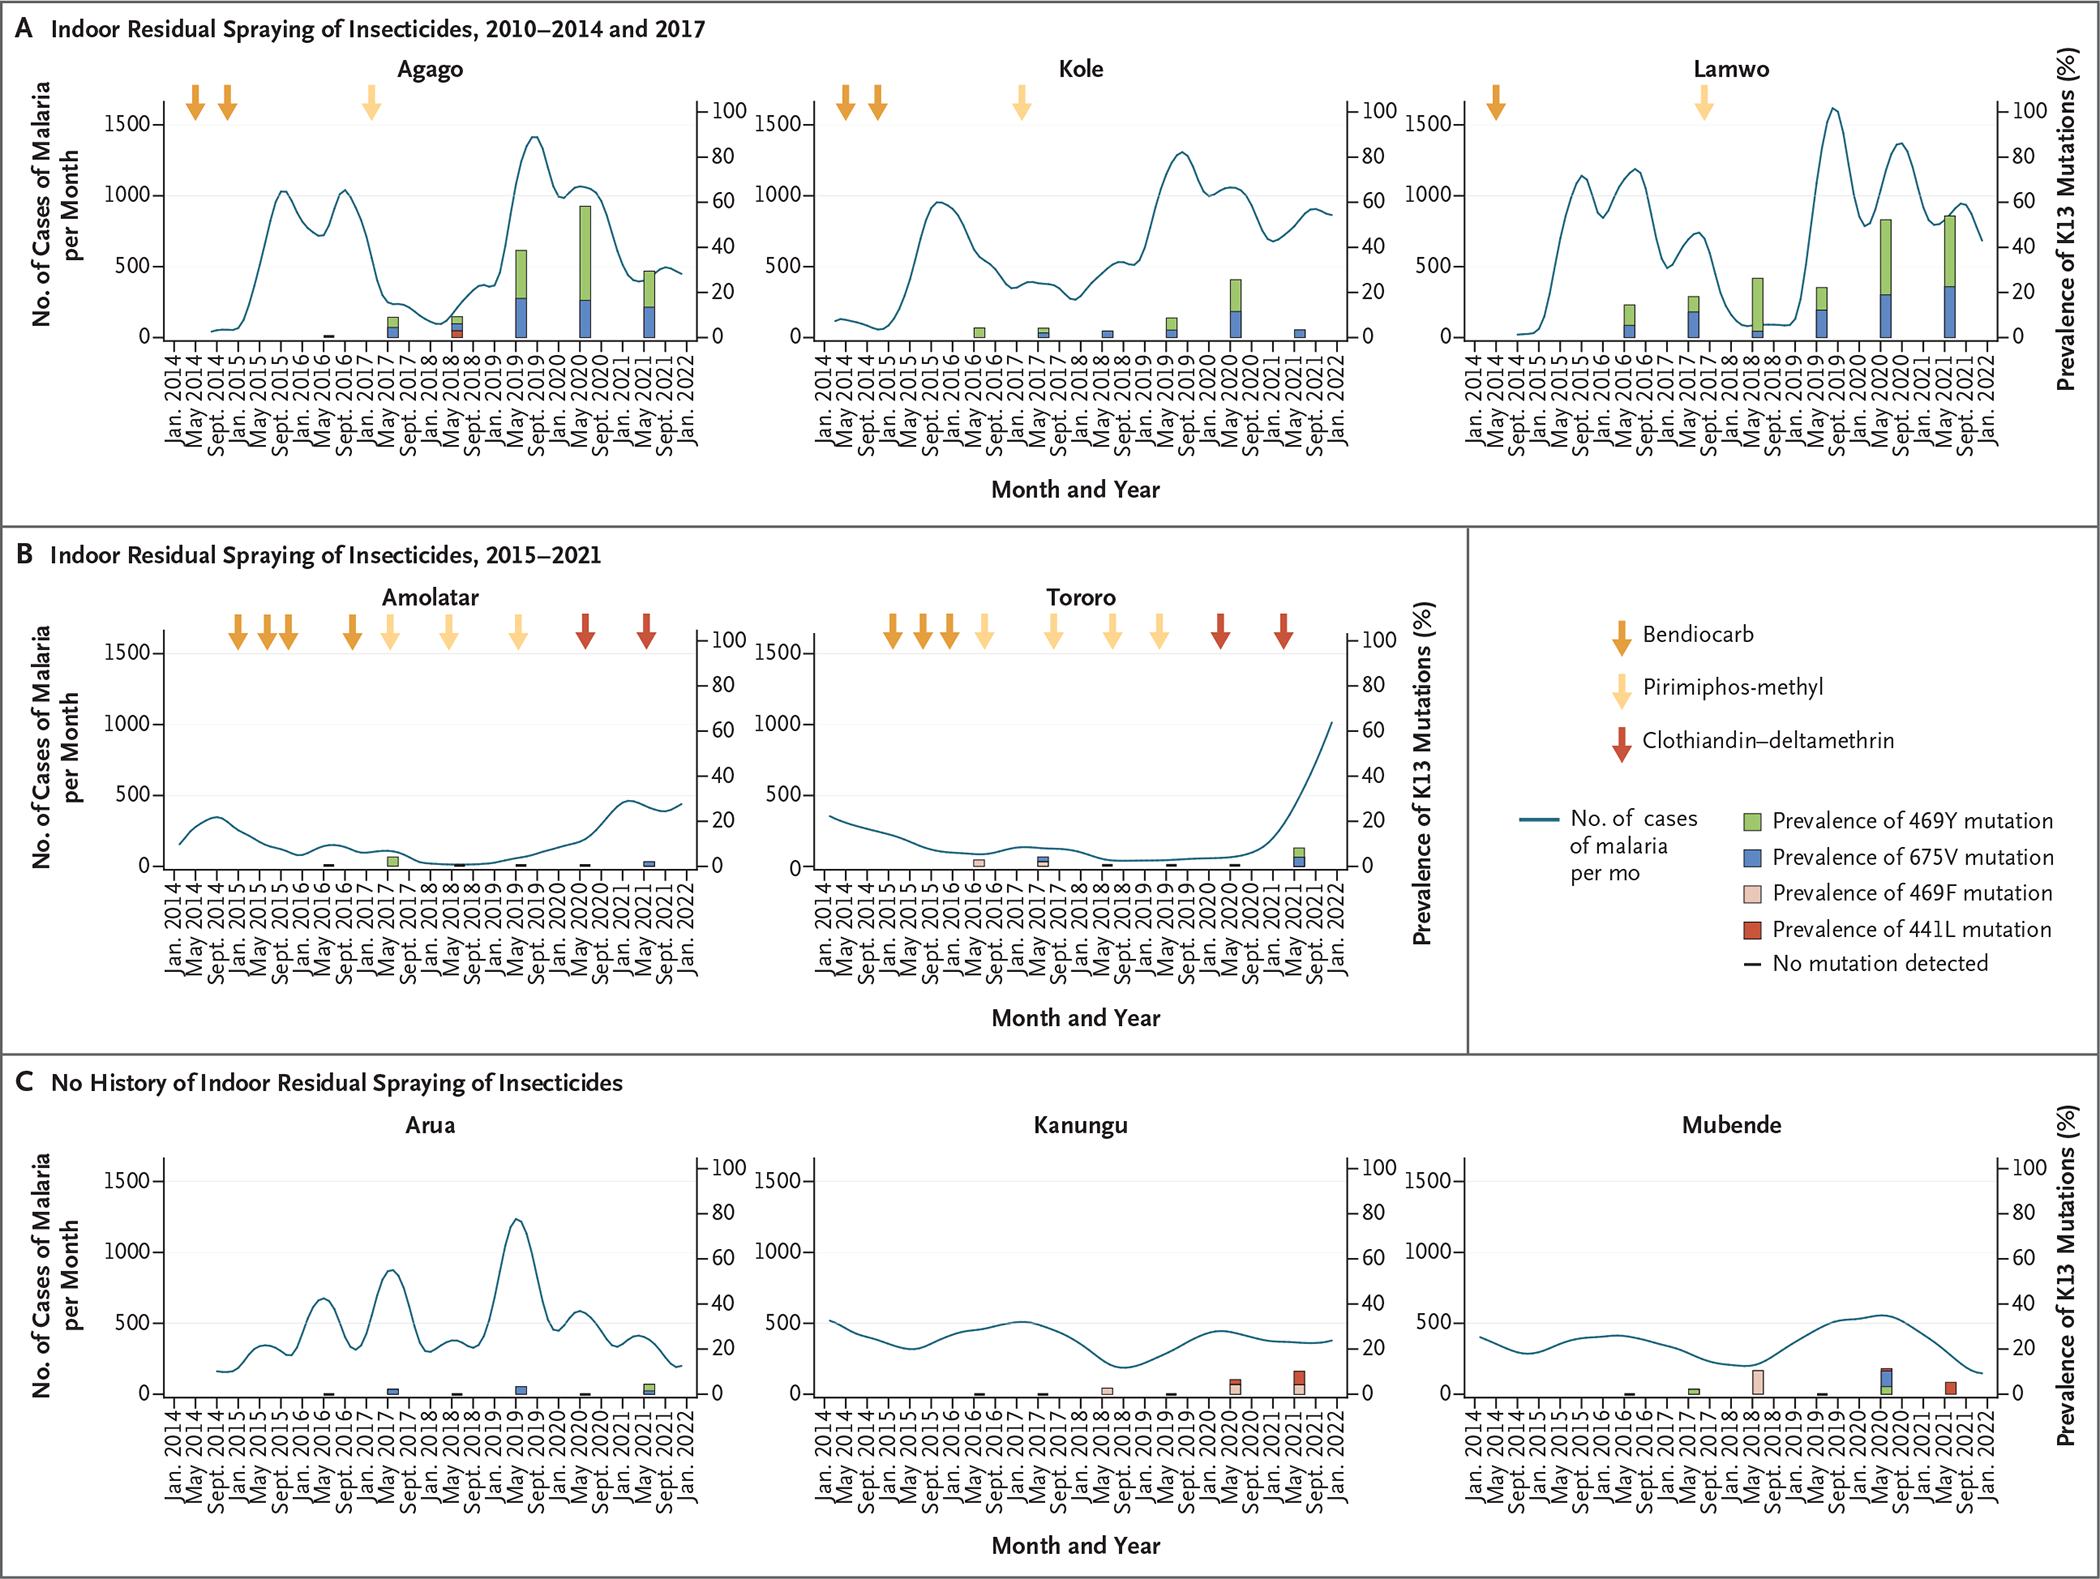
Figure 4. Relationship between Malaria Metrics and Prevalence of PfK13 Mutations.

Malaria incidence and mutation prevalence are shown for sites that received indoor residual spraying of insecticides. The metrics shown were assessed monthly and are displayed with locally weighted scatterplot smoothing. Arrows indicate times of insecticide application; the darkest arrows indicate an apparently ineffective insecticide (clothiandin–deltamethrin). Histogram bars indicate the prevalence of PfK13 mutations. A horizontal dash along the x axis indicates sample collection occurred but no mutations were detected. Other metrics of malaria (test positivity and median age of presentation with malaria) are shown in Figures S1, S2, and S3.
