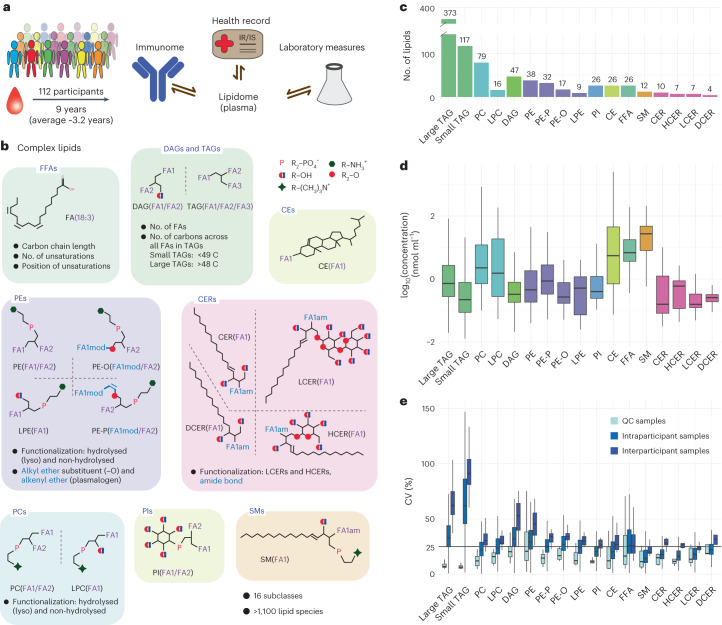
Fig. 1. Longitudinal lipidomics profiling.
a, Profiling, using >1,500 biosamples, across 112 participants followed for up to 9 years. Dynamic changes in the lipidome were characterized in the context of health status and medication history and in comparison with the participants’ cytokine, chemokine and metabolic profiles, as well as microbiome. b, Lipid subclasses investigated in this study. Lipid species, defined by a specific combination of backbone architecture and FAs, can be grouped based on their physicochemical properties. c, We analysed 846 lipids (y axis) across multiple subclasses. d, Across all 112 participants (median estimated concentration across all participant-specific samples), lipid species (846) spanned a dynamic range of more than four orders of magnitude, with distinct estimated concentration ranges for each lipid species and subclass. e, Comparison of the CVs of QC (n = 104), intraparticipant and interparticipant samples. All boxplots report the 25% (lower hinge), 50% (centre line) and 75% (upper hinge) quantiles. Whiskers indicate observations equal to or outside the hinge ± 1.5× the interquartile range (IQR). Outliers (beyond 1.5× the IQR) are not plotted.

