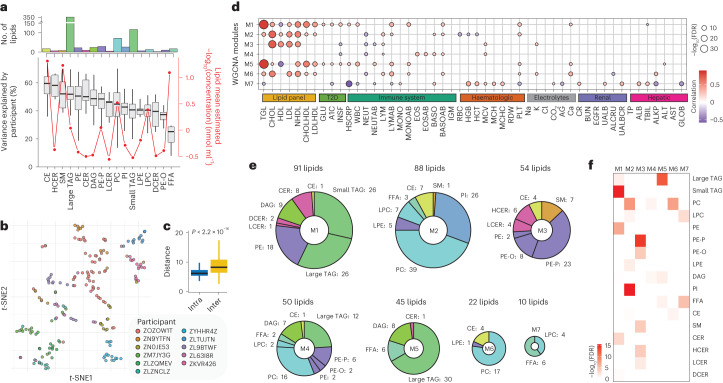
Fig. 2. Interindividual differences in healthy baseline.
a, Top, bar plot showing the number of lipid species per class ordered by the variance explained by the participant factor; bottom, boxplot showing the variance explained by participants in each lipid class (left y axis) and line graph showing the mean log10(estimated concentration) (red line, right y axis) of each lipid class. Variance decomposition analysis was conducted using n = 802 healthy samples. b, t-SNE clustering of 11 participants who contributed ≥12 healthy samples (n = 191), based on the 100 most personalized lipids. c, Intraparticipant distance, which refers to the Euclidean distance between each pair of samples belonging to the same participant, and interparticipant distance, which refers to the distance between the centroids from each pair of participants, for the t-SNE results. Boxplots report the 25% (lower hinge), 50% (centre line) and 75% (upper hinge) quantiles. Whiskers indicate observations equal to or outside the hinge ± 1.5× the IQR. Outliers (beyond 1.5× the IQR) are not plotted. The intraparticipant and interparticipant distances were compared using a two-sided t test. d, WGCNA modules and their correlation (BH-adjusted FDR cut-off of 5%) with clinical measures. Dot size depicts the BH-adjusted −log10(FDR). The colour scale indicates the degree and direction of the correlation. TGL, total triglyceride; CHOL, total cholesterol; NHDL, non-HDL; CHOLHDL, cholesterol to HDL ratio; LDLHDL, LDL to HDL ratio; GLU, glucose; INSF, fasting insulin; HSCRP, high-sensitivity CRP; WBC, white blood cell count; NEUT, neutrophil percent; NEUTAB, neutrophil absolute count; LYM, lymphocyte percent; LYMAB, lymphocyte absolute count; MONO, monocyte percent; MONOAB, monocyte absolute count; EOS, eosinophil percent; EOSAB, eosinophil absolute count; BASO, basophil percent; BASOAB, basophil absolute count; IGM, immunoglobulin M; RBC, red blood cell count; HGB, haemoglobin; HCT, haematocrit; MCV, mean corpuscular volume; MCH, mean corpuscular haemoglobin; MCHC, mean corpuscular haemoglobin concentration; RDW, red cell distribution width; PLT, platelet; AG, albumin to globulin ratio; CR, creatinine; BUN, blood urea nitrogen; EGFR, estimated glomerular filtration rate; UALB, urine albumin; ALCRU, aluminium to creatinine ratio, urine; UALBCR, urine albumin to creatinine ratio; TP, total protein; ALB, albumin; TBIL, total bilirubin; ALKP, alkaline phosphatase; ALT, alanine aminotransferase; AST, aspartate aminotransferase; GLOB, globulin. e, Module composition for the WGCNA analysis shown in c, coloured by lipid subclass. f, Enrichment analysis results based on Fisher’s exact test, depicting the BH-adjusted −log10(FDR) for enriched subclasses for each WGCNA module.

