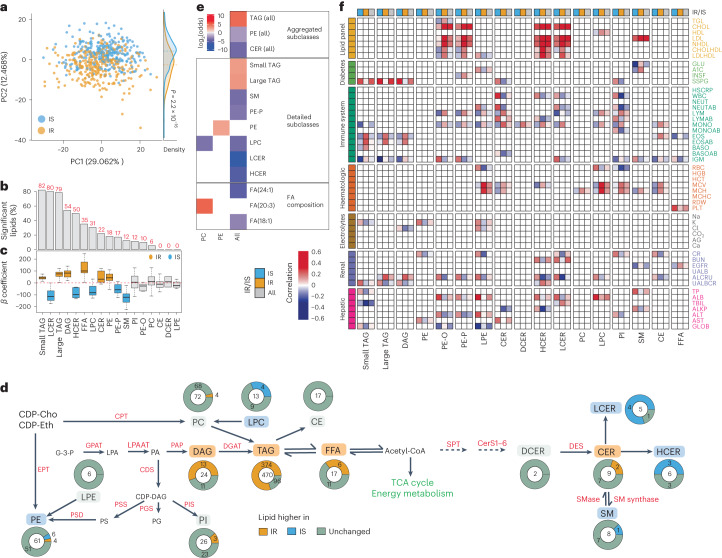
Fig. 3. IR- and IS-associated lipid signatures.
a, Principal component analysis comparing IR and IS. The density plot on the right indicates the distribution of eigenvectors for each data point along the second principal component (PC2). Eigenvector comparison between IR and IS was conducted using a two-sided t test. b, Regression analysis (n = 69): 424 of 736 lipids had significant correlations with SSPG (BH FDR < 5%; corrected for age, sex, ethnicity and baseline BMI). c, Boxplot depicting regression coefficients for the respective lipid classes by using 69 samples for which the SSPG level was measured at the visit. Larger coefficients indicate stronger associations with higher SSPG levels. Colour indicates distributions for which the 25th or 75th percentile is positive or negative. Boxplots report the 25% (lower hinge), 50% (centre line) and 75% (upper hinge) quantiles. Whiskers indicate observations equal to or outside the hinge ± 1.5× the IQR. Outliers (beyond 1.5× the IQR) are not plotted. d, Proportional differences between IR and IS detected in participants. Centre numbers indicate the total number of lipids in each class. Enzyme names are shown in red. CDP-Cho, cytidine diphosphocholine; CDP-Eth, cytidine diphosphoethanolamine; CPT, choline phosphotransferase; EPT, ethanolamine phosphotransferase; GPAT, glycerol-3-phosphate acyltransferase; LPAAT, lysophosphatidic acid acyltransferases; PAP, phosphatidate phosphatase; DGAT, DAG acyltransferase; G-3-P, glyceraldehyde-3-phosphate; CDS, CDP-diacylglycerol synthase; PSD, PS decarboxylase; PSS, PS synthase; PGS, PG synthase; PIS, PI synthase; SPT, serine palmitoyl transferase; CerS, ceramide synthase; SMase, sphingomyelinase; DES, dihydroceramide desaturase; Acetyl-CoA, acetyl coenzyme A; TCA, tricarboxylic acid. e, Enrichment analysis (Fisher’s exact test) performed on the coefficients from SSPG regression. Enriched annotations were calculated for positive coefficients with BH FDR < 10% (positive log2(odds)) and negative coefficients with BH FDR < 10% (negative log2(odds)). For enriched annotations, a BH FDR cut-off of 5% was applied. f, Correlations between clinical measures and lipid profiles for IR and IS. Correlations are shown when the correlations in IR and IS were significantly different and the absolute Δ correlations in IR and IS were >0.2. In addition, the overall correlations between lipids and clinical measures across IR and IS are depicted when the aforementioned two criteria were met.

