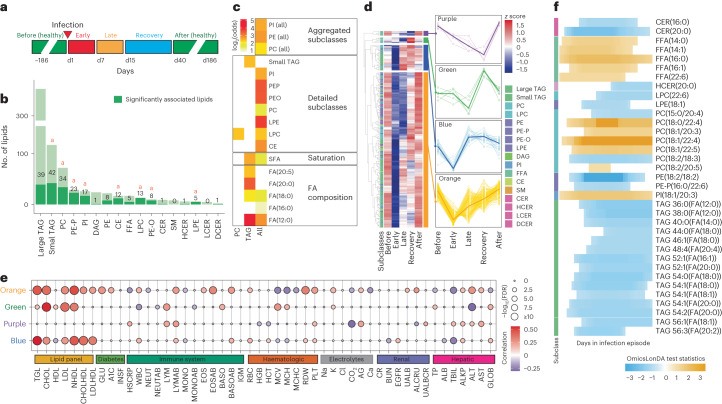
Fig. 4. RVIs and vaccination.
a, Longitudinal sampling at five timepoints during RVIs: before infection (healthy), early event, late event, recovery and after infection (healthy). b, Lipid class breakdown for all detected lipids. Dark green depicts 210 significantly changed lipids throughout RVI. aEnriched subclass. Fisher’s exact test was used for the lipid class enrichment analysis of the significant lipids (BH FDR for each lipid subclass: CE, 3.35 × 10⁻⁴; CER, 0.95; DCER, 0.49; HCER, 0.87; LCER, 1; DAG, 1; FFA, 0.56; LPC, 6.32 × 10⁻⁸; LPE, 8.40 × 10⁻³; PC, 3.01 × 10⁻⁴; PE, 0.27; PE-O, 1.01 × 10⁻³; PE-P, 1.00 × 10⁻⁸; PI, 7.65 × 10⁻⁵; SM, 1; large TAG, 1; small TAG, 3.66 × 10⁻²). c, Lipid enrichment analysis for significantly changed lipids during RVI, across (left column) and within classes. d, Trajectory analysis of the 210 significantly changed lipids following RVI and their corresponding profiles in each cluster. e, Associations of lipid profiles in RVI and clinical measures. Depicted are correlations between the identified lipid clusters (d) and 50 clinical laboratory measures (BH FDR cut-off of 5%). Dot size depicts −log10(FDR); colour scale represents the correlation direction and degree. f, Differential profile of lipids that were significantly changed during RVI, comparing IR and IS. For each lipid feature, the shaded blocks demonstrate the time intervals during which the corresponding lipid was significantly different between IR and IS. The orange shaded blocks representing the lipid profiles at this time interval are dominant (with higher lipid levels) in IR, and the blue shaded blocks representing the lipid profiles at this time interval are dominant in IS.

