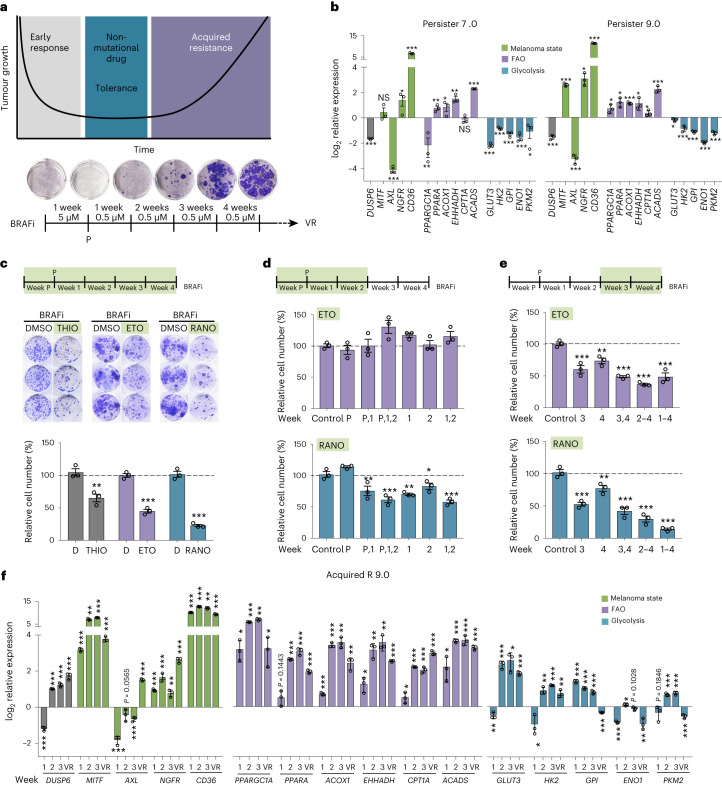
Fig. 1. Fatty acid oxidation is upregulated during BRAFi-acquired resistance development.
a, Protocol for monitoring the establishment of vemurafenib (BRAFi) resistance. P, persister; VR, vemurafenib resistant. b, Quantitative PCR (qPCR) analysis of the indicated genes in BRAFi persister cells. Shown are expression data from persister cells from two independent acquired resistance experiments (7.0 and 9.0) relative to untreated cells. Data are presented as the mean ± s.d. based on n = 3 sample replicates analysed by two-tailed unpaired t-test. *P < 0.05; **P < 0.01; ***P < 0.001. c, Colony formation assay (CFA) quantification for A375 cells treated with BRAFi in the absence (dimethylsulfoxide (DMSO)) or presence of 2 µM THIO, 100 µM ETO or 100 µM RANO added once per week. Data are presented as the mean ± s.e.m. based on n = 3 biological replicates analysed by two-tailed unpaired t-test. **P < 0.01; ***P < 0.001. d,e, CFA quantification of A375 cells treated with BRAFi in the absence (control) or presence of ETO or RANO added once per week during the early (d) or late (e) stage of treatment as indicated. Data are presented as the mean ± s.e.m. based on n = 3 biological replicates analysed by one-way analysis of variance (ANOVA) with Dunnett’s multiple-comparisons test. *P < 0.05; **P < 0.01; ***P < 0.001. f, qPCR analysis of the indicated genes in A375 cells treated with BRAFi. Shown is the expression at weeks 1, 2 and 3 after the establishment of persister 9.0 and in BRAFi-resistant VR 9 cells relative to untreated cells. Data are presented as the mean ± s.d. based on n = 3 sample replicates analysed by two-tailed unpaired t-test. *P < 0.05; **P < 0.01; ***P < 0.001. NS, not significant.

