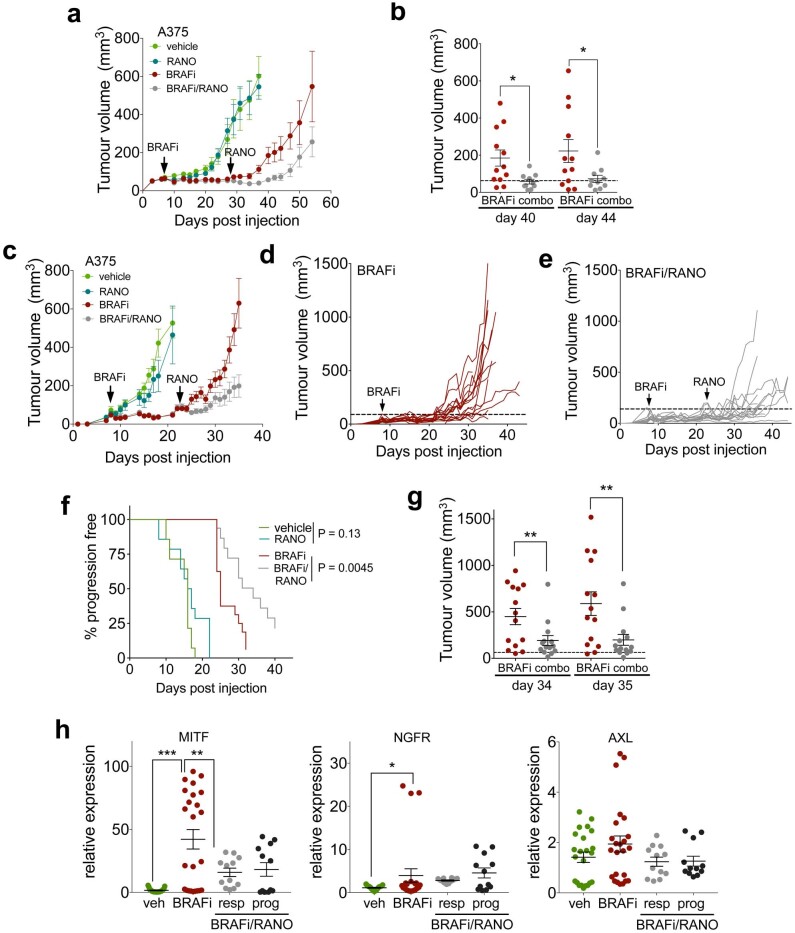
Extended Data Fig. 4. Ranolazine improves BRAFi therapy.
a, Growth curves of tumours from female mice treated with vehicle, RANO alone 50 mg/kg, daily, BRAFi alone (25 mg/kg, daily) or with BRAFi (25 mg/kg, daily) and RANO (50 mg/kg, daily), RANO was added at day 28 when BRAFi treated tumours showed a reduced response to treatment. Data are presented as mean ± s.e.m. based on n = 12 tumours in each group. b, Tumour end volume of female mice treated with BRAFi (n = 12) or the combination (combo) of BRAFi with RANO (n = 10) at days 40 and 44 of treatment. Data are presented as mean ± s.e.m. analysed by one-way ANOVA with uncorrected Fisher’s LSD. *P < 0.05. c, Growth curves of tumours from male mice treated with vehicle, RANO alone 50 mg/kg, daily, BRAFi alone (25 mg/kg, daily) or with BRAFi (25 mg/kg, daily) and RANO (50 mg/kg, daily), RANO was added at day 23 when BRAFi treated tumours showed a reduced response to treatment. Data are presented as mean ± s.e.m. based on n = 13 tumours in vehicle group, 14 tumours in RANO and BRAFi/RANO group and 16 in the BRAFi group. d,e, Growth curves of individual tumours from male mice treated with (d) BRAFi alone or (e) with BRAFi and RANO as described in (c). f, Kaplan-Meier plots of progression free survival of male mice treated as indicated. Progression was declared when tumours exceeded a volume of twice the volume at day 8, when BRAFi was added (dashed line). Log-rank (mantel Cox) test: BRAFi vs BRAFi/RANO HR = 2.58. g, Tumour end volume of mice treated as indicated in (c) at days 34 and 35 of treatment. Data are from n = 14 tumours and presented as mean ± s.e.m. analysed by one-way ANOVA with uncorrected Fisher’s LSD. **P < 0.01. h qPCR analysis of the indicated genes in A375 tumours from mice treated as indicated. Data are triplicates from n = 8 tumours for vehicle or BRAFi, n = 4 tumours for RANO responder (resp) or RANO progressed (prog), respectively. Data and are presented as mean ± s.e.m. analysed by one-way ANOVA with uncorrected Fisher’s LSD. *P < 0.05; **P < 0.01; ***P < 0.001.

