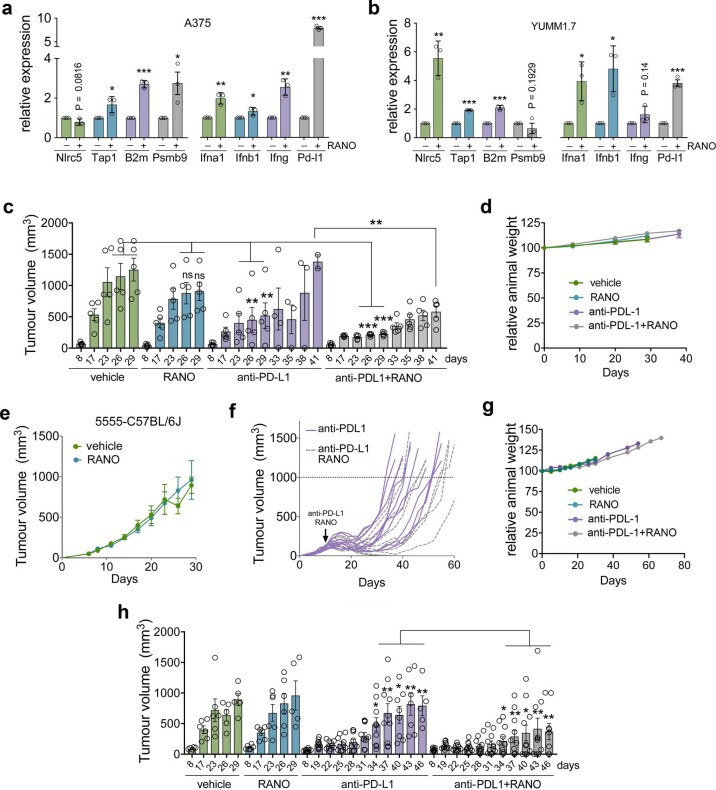
Extended Data Fig. 7. Ranolazine improves anti-PD-L1 therapy.
a,b, mRNA expression of the indicated genes in (a,) A375 human melanoma cells and in (b) YUMM1.7 mouse melanoma cells after treatment with RANO. Expression in untreated cells was set 1. Data are presented as mean ± s.e.m. based on n = 3 biological replicates and analysed by two-tailed unpaired t-test. *P < 0.05; **P < 0.01; ***P < 0.001. c, Tumour volume at the indicated days in male C57BL/6 mice treated with vehicle, RANO (300 mg/kg, daily), anti-PD-L1 (10 mg/kg, every 3 days) or anti-PD-L1 and RANO (300 mg/kg, daily) starting at day 6. Data are presented as mean ± s.e.m. based on n = 5 mice in each group and analysed by one-way ANOVA with uncorrected Fisher’s LSD. **P < 0.01; ***P < 0.001; P = 0.2245; P = 0.1194. d, Relative animal weight of mice related to (c). Data are presented as mean ± s.e.m. e, Tumour growth curves of female C57BL/6 mice treated with vehicle or RANO (300 mg/kg/daily). Data are presented as mean ± s.e.m. based on n = 5 mice in each group. f, Growth curves of individual tumours from female C57BL/6 mice treated with anti-PD-L1 (10 mg/kg, every 3 days) or anti-PD-L1 and RANO (300 mg/kg, daily) starting at day 6. n = 10 tumours for anti-PD-L1 and 11 for the combination treatment. g, Relative animal weight of mice related to (e,f). Data are presented as mean ± s.e.m. h, Tumour volume at the indicated days in female C57BL/6 mice treated as described in (e,f). Data are presented as mean ± s.e.m. based on 10 tumours for anti-PD-L1 and 11 for the combination treatment, analysed by one-way ANOVA with uncorrected Fisher’s LSD. **P < 0.01; ***P < 0.001.

