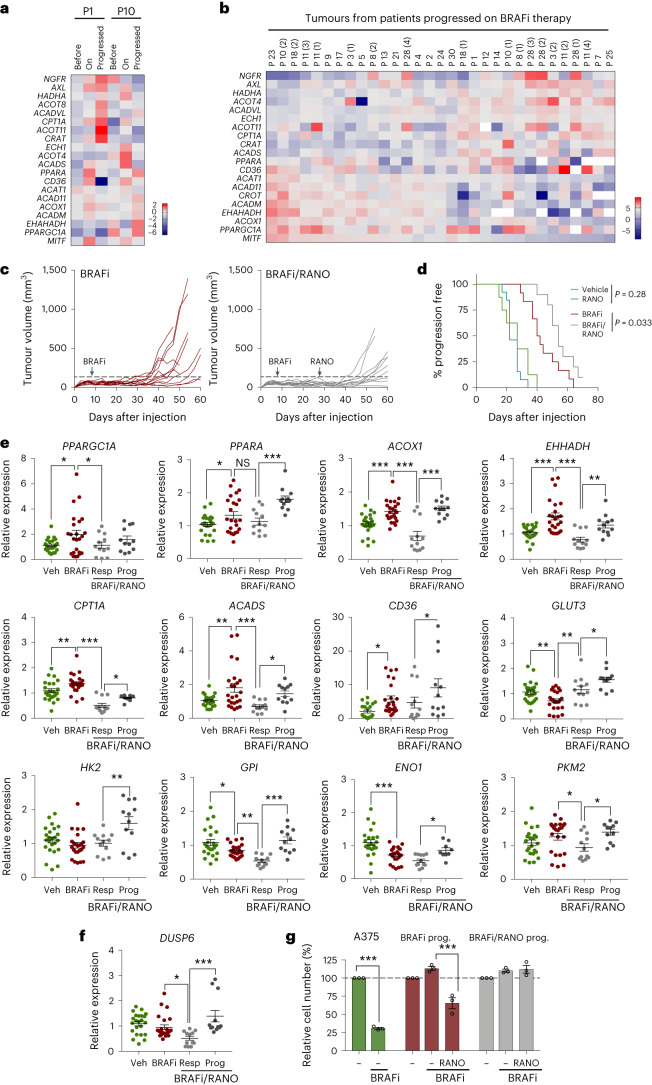
Fig. 3. Ranolazine delays BRAFi-acquired resistance in vivo.
a,b, Analysis of publicly available gene expression datasets GSE61992 (ref. 61) and GSE50509 (ref. 62). Data from 2 patients (GSE61992) before and on treatment, and at the time of progression (a) or 31 tumours from 21 patients (GSE50509) before treatment and at the time of progression (b) were analysed for expression of the indicated genes. For b, the log2 fold change at the time of progression relative to ‘before’ is shown. The number of individual tumours from patients with more than one tumour is indicated in brackets. c, Growth curves of individual tumours from female mice treated with BRAFi alone (25 mg per kg body weight, daily on day 7) or with BRAFi and RANO (50 mg per kg body weight, daily), which was added at day 28 when BRAFi-treated tumours showed a reduced response to treatment. n = 12 tumours in each group. d, Kaplan–Meier plots of progression-free survival of female mice treated as indicated. Progression was declared when tumours exceeded a volume of twice the average volume of day 7, when BRAFi treatment commenced (dashed line). Log-rank (Mantel–Cox) test: BRAFi versus BRAFi/RANO hazard ratio (HR) = 2.88. e,f qPCR analysis of the indicated genes in A375 tumours from female mice treated as indicated. Data are triplicates from n = 8 tumours for vehicle or BRAFi, and n = 4 tumours for RANO responder (resp) or RANO progressed (prog), respectively, and are presented as the mean ± s.e.m. analysed by one-way ANOVA with uncorrected Fisher’s LSD. *P < 0.05; **P < 0.01; ***P < 0.001. g, Relative cell number of cell cultures established from tumours progressed on BRAFi or BRAFi/RANO treated with BRAFi in the absence (DMSO) or presence of RANO. A375 cells served as the control. Data are presented as the mean ± s.e.m. based on n = 3 biological replicates analysed by one-way ANOVA with Sidak’s multiple-comparisons test. ***P < 0.001.

