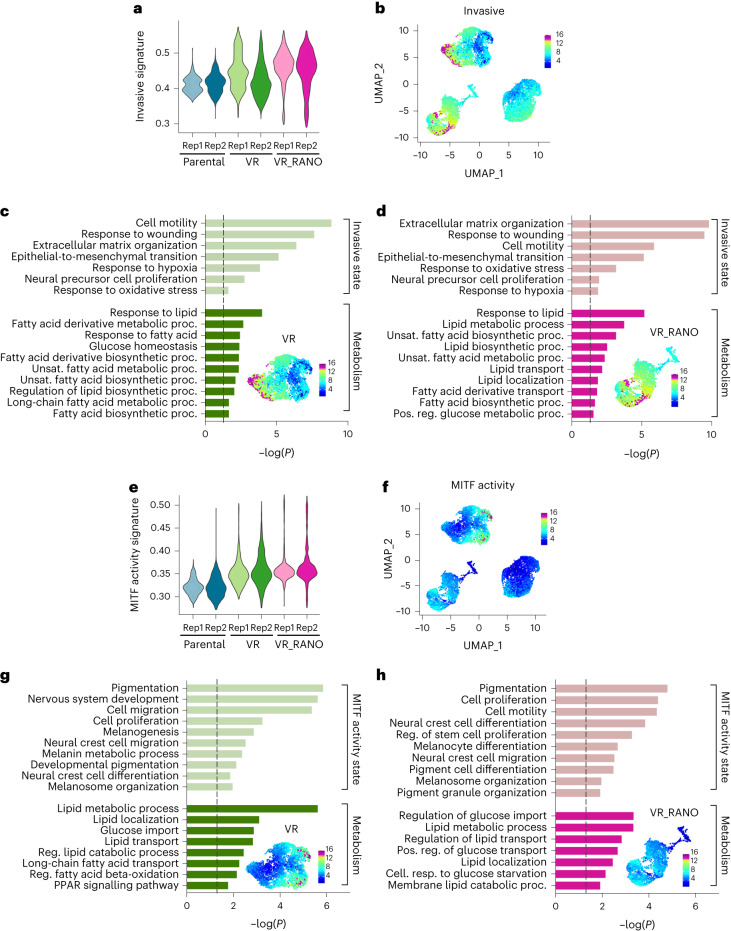
Fig. 5. Ranolazine alters the metabolic state of BRAFi-resistant melanoma cells.
a, Invasive state signature scores represented by violin plots. b, UMAP plot coloured by the expression of the invasive state. c,d, GOBP terms enriched (hypergeometric tests) in the subset of genes (top 200) most highly correlated to the invasive signature scores in VR (c) or VR_RANO (d) cells. The dashed line indicates P = 0.05. Relevant UMAP plots coloured for the respective melanoma states are indicated. e, MITF activity state signature scores represented by violin plots. f, UMAP plot coloured by the expression of the MITF activity state. g,h, GOBP terms enriched (hypergeometric tests) in the subset of genes (top 200) most highly correlated to the MITF activity signature scores in VR (g) or VR_RANO (h) cells. The dashed line indicates P = 0.05. Relevant UMAP plots coloured for the respective melanoma states are indicated.

