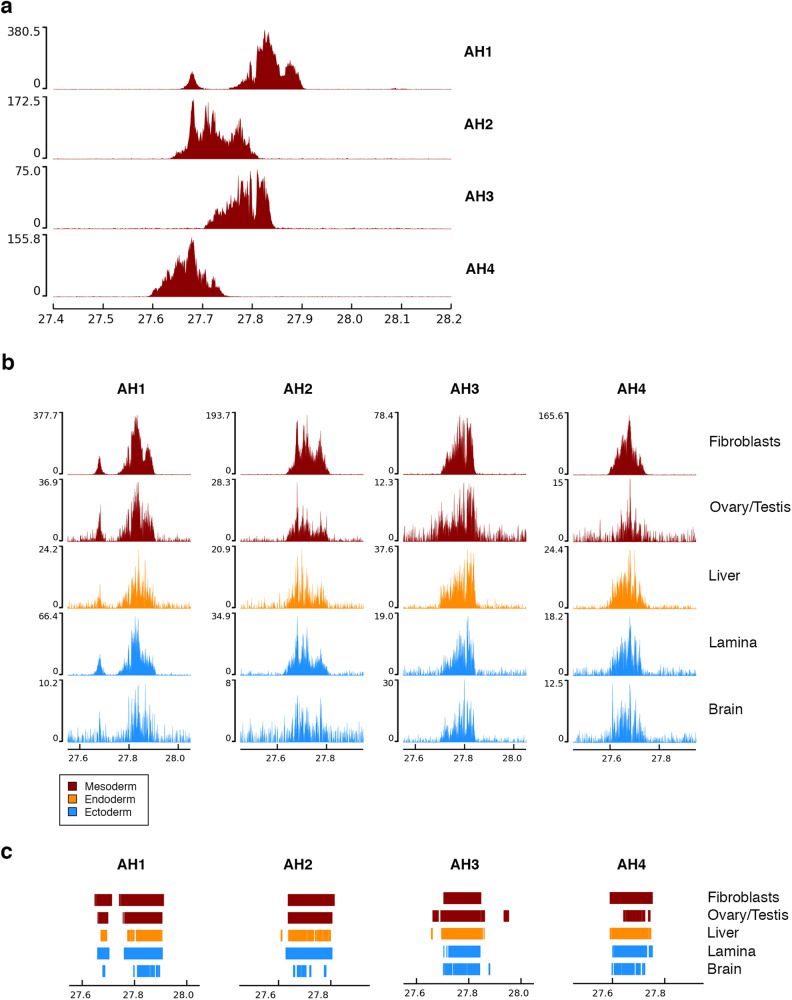
Fig. 2. ChIP-seq characterization of the ECA11 satellite-free centromere in the FAANG horses.
a ChIP-seq characterization of the ECA11 satellite-free centromere in the fibroblast cells lines from the FAANG mares (AH1 and AH2) and the FAANG stallions (AH3 and AH4). ChIP-seq reads from primary fibroblasts were mapped on the EquCab3.0_cen reference. The CENP-A enriched domains are visualized as peaks. The y-axis reports the normalized read counts whereas the x-axis reports the coordinates on the reference genome. b ChIP-seq profiles of the CENP-A binding domain on ECA11 in the fibroblast cell line (top) and in four tissues of different embryonic origin from the FAANG mares (AH1 and AH2) and FAANG stallions (AH3 and AH4). Color code refers to the embryonic origin. The y-axis reports the normalized read counts whereas the x-axis reports the coordinates on the EquCab3.0_cen reference genome. The scale of the y-axis is not the same across samples to highlight the position of the peak rather than its height. c Enrichment peaks obtained using SICER2.

