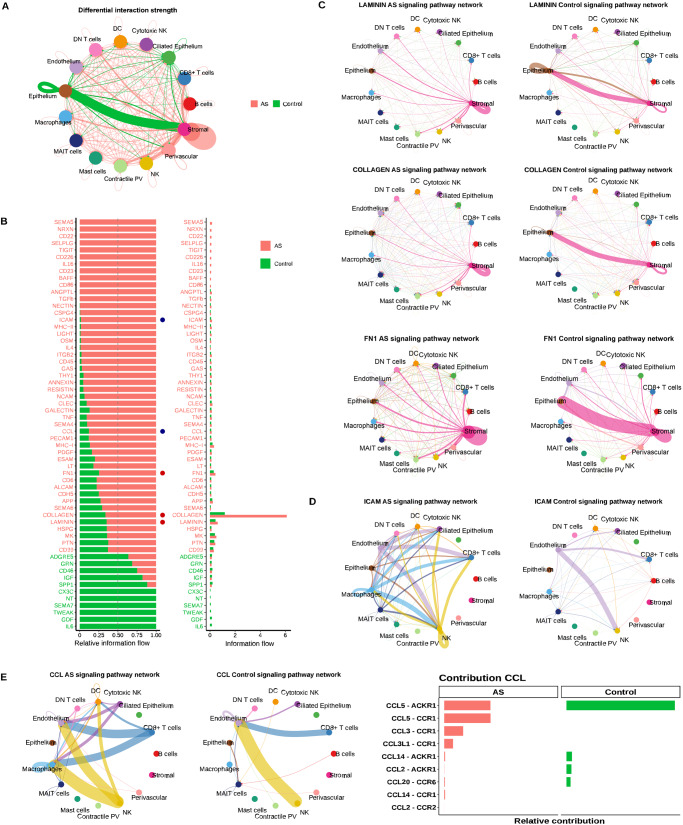
Fig. 4. Differential cell-to-cell communications between Asherman’s syndrome and control endometria.
A Chord plot displaying differentially active CCC comparing AS and control endometria. Arrows between cell types depict the direction of interactions. Relative thicknesses of red (AS) and green (Control) arrow lines represent the expression-based strength of the interaction between cell types. B Relative and absolute flows of differentially active signaling pathways between AS and control endometria (two-sided Wilcoxon test; FDR > 0.05). Blue dots = pathways involved in immune cell recruitment and inflammation. Red dots = pathways involved in ECM and fiber formation. CCC chord plots of C LAMININ, COLLAGEN, FN1, and D ICAM signaling pathways in AS and control endometria. Arrows follow the color code of cell types commonly detected in AS and control cartographies. E CCC chord diagrams of CCL signaling pathway in AS and control endometria (left panel). Ligands and receptors contributing to CCCs of the C-C motif chemokine ligand (CCL) signaling pathway (right panel). AS Asherman’s syndrome, DC dendritic cells, DN double negative, MAIT mucosal-associated invariant T, NK natural killer, PV perivascular, SMC smooth muscle cells.

