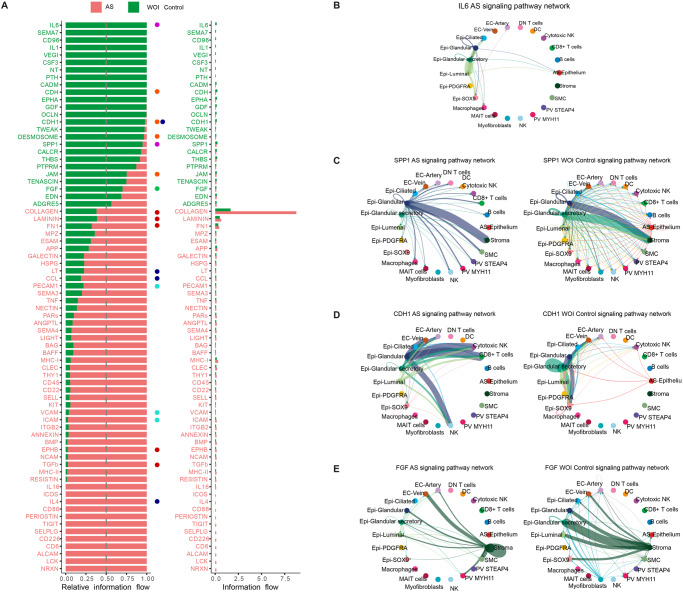
Fig. 5. Molecular profiling and refined cell-to-cell communication analysis of Asherman’s syndrome compared to control endometria during the window of implantation.
A Relative and absolute information flow for each differentially detected signaling pathway differentially detected in AS and WOI control endometria (two-sided Wilcoxon test, FDR > 0.05). Blue dots = immune system signaling pathways. Red dots = ECM- related pathways. Green dots = pathways involved in epithelial development. Cyan dots = pathways related to immune cell recruitment. Purple dots = signaling pathways of the WOI and decidualization processes. Orange dots = signaling pathways related to cell junctions and cellular unions. CCC chord diagrams displaying B IL6 (AS only), C SSP1, D CDH1, and E FGF signaling pathways in AS and WOI control endometria. AS Asherman’s syndrome, DC dendritic cells, DN double negative, Epi epithelial, FDR false discovery rate, MAIT mucosal-associated invariant T, NK natural killer, PV perivascular, SMC smooth muscle cells, WOI window of implantation.

