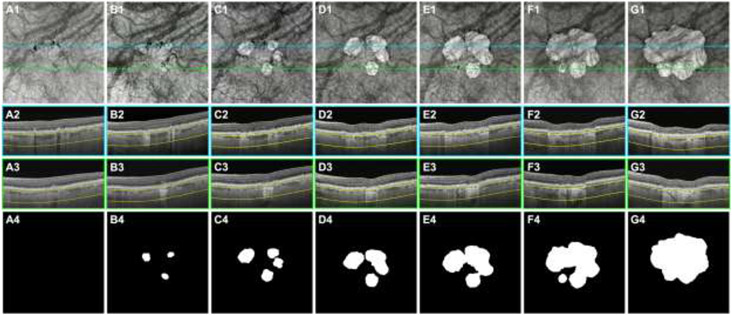
Figure 2:
Swept-source OCT (SS-OCT) imaging of the left eye from an 85-year-old woman beginning with intermediate age-related macular degeneration (iAMD) and progressing to persistent choroidal hypertransmission defects (hyperTDs) over a 72-month period. Column A represents the baseline visit, column B represents the 16-month follow-up visit, column C represents the 24-month follow-up visit, column D represents the 36-month follow-up visit, column E represents the 48-month follow-up visit, column F represents the 57-month follow up visit, and column G represents the 72-month follow-up visit. Row 1 shows the en face SS-OCT structural images that were created using a slab positioned from 64 to 400 μm under Bruch’s membrane. Rows 2 and 3 show the respective B-scans identified by the color-coded lines on the en face SS-OCT images. Row 4 shows the outlines of the hyperTDs that were generated by the algorithm and were manually edited if needed. (A1-A4) At the baseline visit, hyperpigmentation which are seen as hypotransmission defects (hypoTDs) or dark areas on the en face SS-OCT image are present. This is confirmed on the respective B-scan (A2) showing intraretinal hyperreflective foci. No hyperTDs are present at this visit (A1 and A4). (B1-B4) At the 16-month follow-up visit, three individual hyperTDs are seen on the en face SS-OCT image (B1) and are confirmed with their respective B-scans showing hypertransmission below the choroid and attenuation of the outer nuclear layer (B2-B3). The outlines of the three hyperTDs are shown (B4). (C1-C4) At the 24-month follow-up visit, the three individual hyperTDs have enlarged with an additional hyperTD appearing on the en face SS-OCT image (C1). The outlines of the four individual hyperTDs are shown (C4). (D1-D4) At the 36-month follow-up visit, the hyperTDs continue to enlarge with two of the lesions merging together on the en face SS-OCT image (D1) and respective outline (D4). (E1-E4) At the 48-month follow-up visit, all four hyperTDs have grown and merged together to form one large hyperTD surrounding the fovea, as seen on the en face SS-OCT image (E1) and respective outline (E4). (F1-F4) At the 57-month follow-up visit, the large combined hyperTD continues to grow toward the foveal center. In addition, a fifth hyperTD appears as shown on the en face SS-OCT image (F1) and respective outline (F4). (G1-G4) At the 72-month follow-up visit, the fifth hyperTD combines with the merged lesions and form one large hyperTD that has encompassed the foveal center as shown on the en face SS-OCT image (G1) and respective outline (G4).

