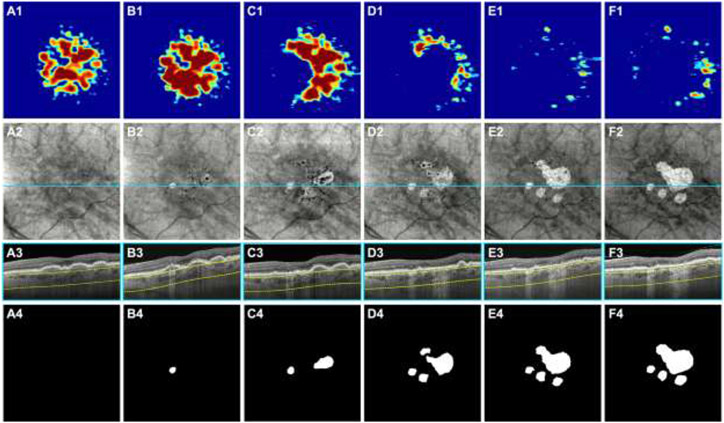
Figure 4:
Swept-source OCT (SS-OCT) imaging of the left eye from a 79-year-old woman beginning with intermediate age-related macular degeneration (iAMD) and progressing to persistent choroidal hypertransmission defects (hyperTDs) over a 60-month period. Column A represents the baseline visit, column B represents the 18-month follow-up visit, column C represents the 24-month follow-up visit, column D represents the 28-month follow-up visit, column E represents the 48-month follow-up visit, and column F represents the 60-month follow-up visit. Row 1 shows the drusen volume maps. Row 2 shows the en face SS-OCT structural images that were created using a slab positioned from 64 to 400 μm under Bruch’s membrane. Row 3 shows the B-scans corresponding to the color-coded lines in the en face SS-OCT images. Row 4 shows the outlines of the hyperTDs that were generated by the algorithm and were manually edited if needed. (A1-A4) At the baseline visit, drusen are present as shown by the drusen volume map (A1) and respective B-scan (A3). There are no hyperTDs present at this visit (A2 and A4). (B1-B4) At the 18-month follow-up visit, a hyperTD appears on the en face SS-OCT image (B2) and is confirmed with the respective B-scan showing hypertransmission below the choroid (B3). The respective outline of the hyperTD is shown (B4). In addition, hypotransmission defects (hypoTDs) or dark areas on the en face image are present which represents hyperpigmentation, and some are shown on the respective B-scan as a thickened RPE layer (B3). (C1-C4) At the 24-month follow-up visit, a second hyperTD emerges on the en face SS-OCT image (C2) and is shown on the respective outline (C4). In addition, some of the drusen have collapsed at this visit as shown by the drusen volume map (C1). (D1-D4) At the 28-month follow-up visit, the existing hyperTDs have enlarged with two more hyperTDs appearing as shown on the en face SS-OCT image (D2) and respective outline (D4). In addition, most of the drusen have disappeared at this visit (D1). (E1-E4) At the 48-month follow-up visit, the hyperTDs have continued to enlarge with two of them merging together. In addition, a fifth hyperTD appears at this visit and is shown on the en face SS-OCT image (E2) and respective outline (E4). (F1-F4) At the 60-month follow-up visit, the hyperTDs have continued to enlarge toward the foveal center (F2 and F4).

