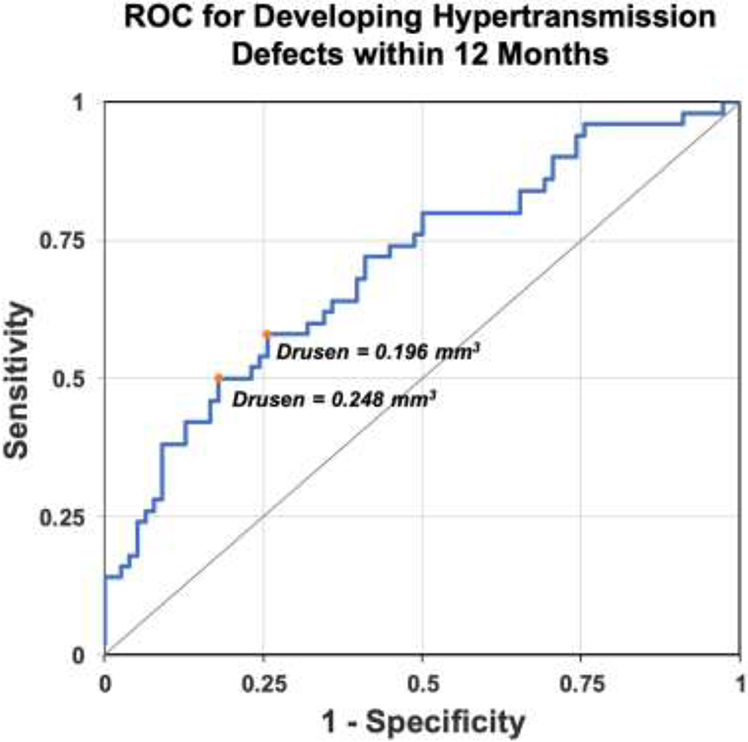
Figure 5:

Receiver operating characteristic (ROC) curve using drusen volume as a risk factor to determine the proportion of cases that would develop persistent choroidal hypertransmission defects (hyperTDs) within 12 months. The gray diagonal line connecting (0,0) to (1,1) is the ROC curve corresponding to random chance (area under the curve [AUC] = 0.5). The blue line represents the ROC curve using drusen volume within the 5 mm circle centered on the fovea as a factor to determine the proportion of cases that would develop hyperTDs in 12 months. The orange dots mark the points on the blue line that are furthest away from the gray diagonal line and identify the optimal drusen volume cutoffs. The chance of developing hyperTDs within 12 months was 58.3% for eyes with a drusen volume ≥ 0.20 mm3 and 63.2% for eyes with a drusen volume ≥ 0.25 mm3. The drusen volume within a 5 mm circle centered on the fovea at 9 to 15 months prior to the onset of hyperTDs or the censored timepoint comprised the analysis dataset for the ROC. The drusen volume nearest to 12 months was used if there were multiple assessments within 9 to 15 months.
