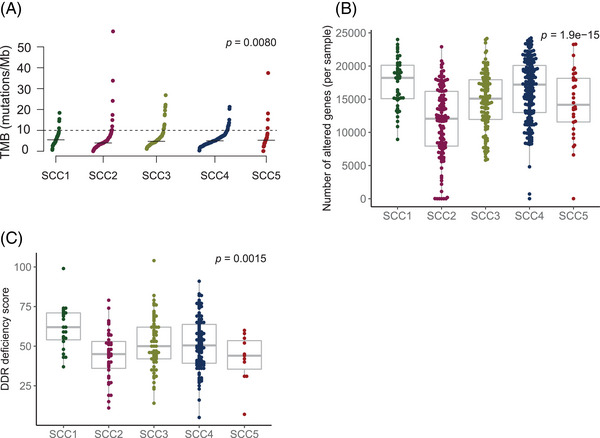
FIGURE 2.

Genomic characterization. (A) Tumor mutational burden (TMB) across lung squamous cell carcinoma (SCC) consensus subtypes. Each dot represents the TMB value for a specific sample. The black segment represents the median TMB value for each lung SCC subtype. Kruskal‐Wallis tests were used to make comparisons between groups. p‐Value was corrected using the false discovery rate (FDR) multiple‐comparisons correction method. (B) Copy number burden across lung SCC subtypes. Each dot represents the number of altered genes per sample. Kruskal‐Wallis tests were used to make comparisons between groups. p‐Value was corrected using the false discovery rate (FDR) multiple‐comparisons correction method. (C) DNA damage repair (DDR) deficiency score distribution across lung SCC subgroups. Each dot represents the DDR score per sample. Kruskal‐Wallis tests were used to make comparisons between groups. p‐Value was corrected using the false discovery rate (FDR) multiple‐comparisons correction method.
