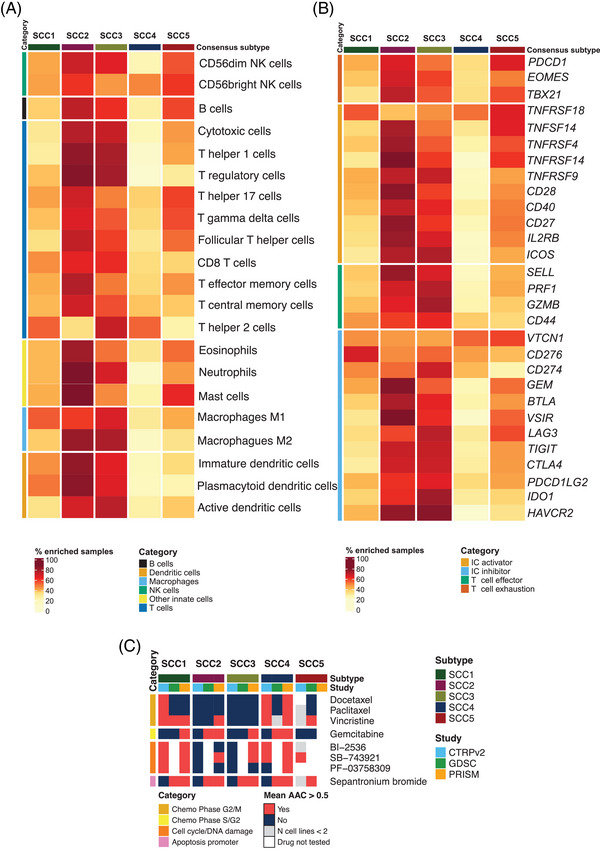
FIGURE 4.

Immune contexture characterization and potential subtype‐specific vulnerabilities. (A) Percentage of samples with high infiltration of each of the 21 evaluated immune cell types. Median immune cell abundance GSVA score values were used as a cut‐off to designate if a sample is enriched for a specific immune cell. Different immune cell categories are represented with different colours on the left side of the heatmap. (B) Percentage of samples with high expression of each of the evaluated immune‐related biomarkers. Median gene expression values for each gene in each gene expression dataset were used as a cut‐off to designate if a sample is enriched for a specific biomarker. Different immune marker categories are represented with different colours on the left side of the heatmap. (C) Potential therapeutic vulnerabilities for the lung squamous cell carcinoma (SCC) subtypes based on CTRPv2, GDSC and PRISM lung SCC cell lines drug sensitivity data. Heatmap representing drugs with mean AAC values greater than 0.5 in at least two studies within the same subtype. Mean AAC values were only calculated if the drug had been tested in at least two different SCC‐CCLs within a subtype and study. Subtypes were considered potentially sensitive to the treatment if the average AAC value for the cell lines classified within a certain group was greater than 0.5 for at least two out of the three evaluated pharmacogenomics studies.
