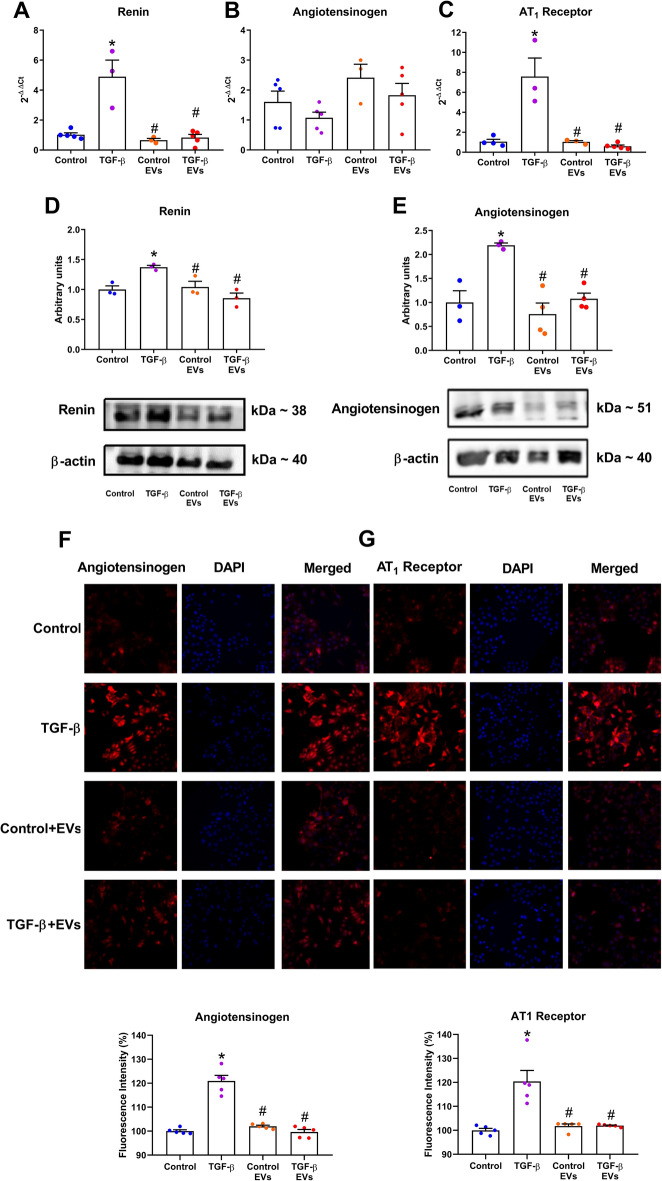
Figure 3.
Effect of EV-iPSCs on gene and protein expression of RAS components. The mRNA expression of renin (A), angiotensinogen (B), and AT1 receptor (C) was evaluated by RT-PCR. The protein expression of renin (D) and angiotensinogen (E) was evaluated by western blot. HPRT and β-actin were used as the reference gene and protein, respectively. The immunofluorescence of angiotensinogen and AT1 receptor was evaluated and quantified by microscopy (F–G). Angiotensinogen and AT1 receptor markers are observed in red, and the nucleus was stained with DAPI (blue). 40× magnification. Images are representative of independent experiments. The results are expressed as the mean ± SEM. p < 0.05: * versus group control; # versus group TGF-β.

