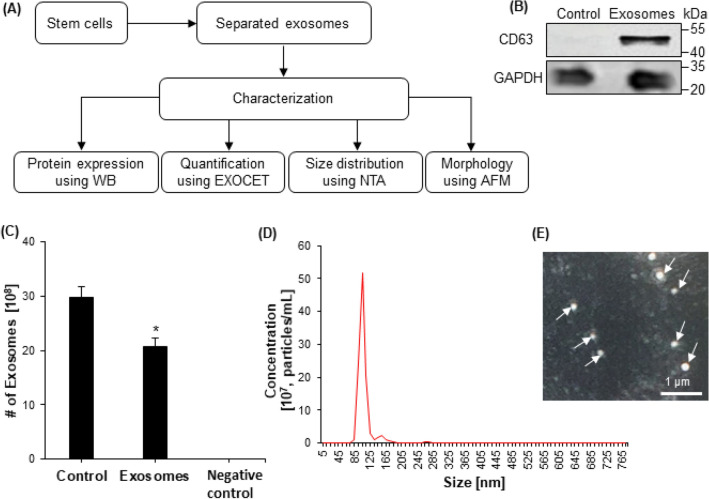
Figure 2.
Characterization of exosomes. (A) A flowchart indicated NSC-exos were separated using centrifugation and characterized for protein expression using WB, size distribution using NTA, and quantification using EXOCET. (B) Protein expression was measured using WB for exosome marker CD63 in control, only cell-free media, and in separated NSC-exos. GAPDH was used as an internal control. (C) Exosomes were quantified using an EXOCET assay in control (unprocessed cell-conditioned media), NSC-exos, and negative control. (D) Concentration of separated exosomes was measured using NTA. The highest peak was observed at 105 nm. (E) Morphology of separated exosomes was visualized using AFM. The circular morphology was easily observed.

