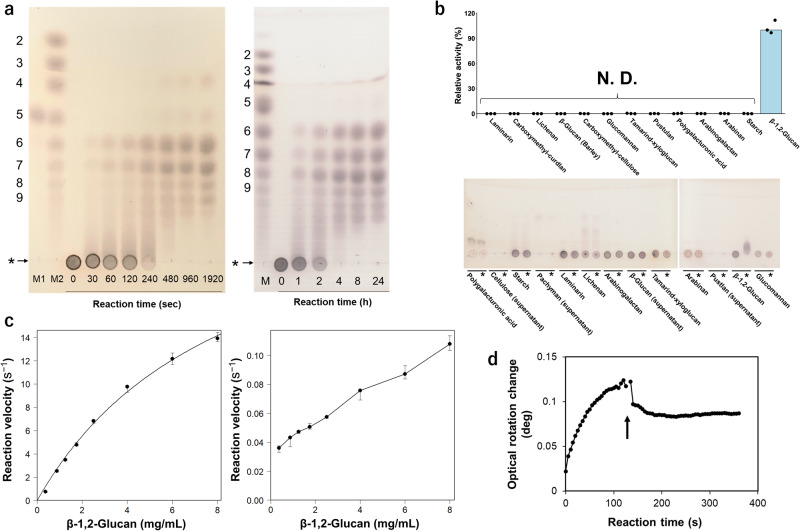
Fig. 1. Catalytic analyses of EcOpgD and EcOpgG.
a TLC analysis of the action patterns of EcOpgD (left) and EcOpgG (right) on β-1,2-glucans. Lane M1, 10 mM Sop5; Lanes M2 and M, a Sopns marker prepared using 1,2-β-oligoglucan phosphorylase from Listeria inocua. DPs of Sopns are shown on the left side of the TLC plates. Arrows represent β-1,2-glucan used for reactions. The origins of the TLC plates are shown as horizontal lines denoted by asterisks. EcOpgD and EcOpgG in the reactions are 0.14 mg/mL and 0.77 mg/mL, respectively. b Substrate specificity of EcOpgD (top) and EcOpgG (bottom). (top) N. D. represents values with less than 0.02% relative activity. Bars represent medians in triplicates. Triplicate data are plotted. (bottom) The reaction was performed at 37 °C for 24 h. Asterisks indicate that the reaction time was 24 h. Other lanes represent a reaction time of 0 h. c Kinetic analysis of EcOpgD (left) and EcOpgG (right). Data plotted as closed circles are medians in triplicates and the other data were used for error bars. (left) Data were regressed with the Michaelis–Menten equation (solid line). (right) Plots were medians in triplicates and simply connected by lines because of poor fitting to the Michaelis–Menten equation. d Time course of the observed optical rotation during β-1,2-glucan-hydrolysis by EcOpgD. The arrow indicates that several drops of aqueous ammonia were added to the reaction mixture 120 s after the reaction started.

