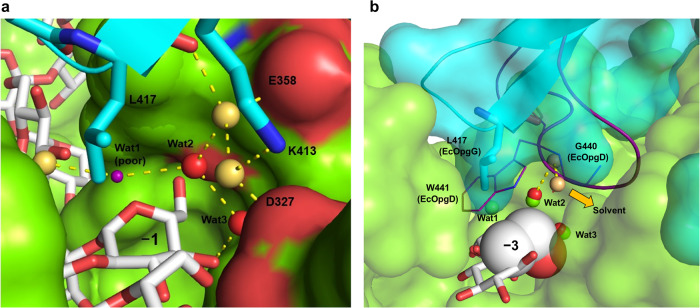
Fig. 6. The environment around Wat2 and Wat3 in the EcOpgG complex structure.
a The positions of the water molecules around subsite –1 of EcOpgG. A small purple sphere is shown as a tentative water molecule with poor electron density (Wat1). Wat2 and Wat3 and the other water molecules are shown in red and beige spheres, respectively. K413 and L417 are shown as cyan sticks. Chains A and B are shown in blue cartoon and green surface representations, respectively. The substrate is shown as a white stick. b Superposition showing the spatial position of Loop A in EcOpgG and EcOpgD. The superimposed Loop A in the EcOpgD complex is shown in purple. G440 and W441 are shown as lines. Wat1–3 molecules in EcOpgD are shown as light green spheres. EcOpgG is shown as a semi-translucent surface. L417 is shown in cyan. The water molecules of EcOpgG are shown as presented in (a), except that Wat1 (poor) is omitted. The Glc moieties at subsites –1 and –3 of EcOpgG are shown as white sticks. C5, C6, and O6 atoms of the Glc moiety at subsite –3 in EcOpgG are shown as spheres of van der Waals radii. The thick yellow arrow represents another proton network that leads to the solvent.

