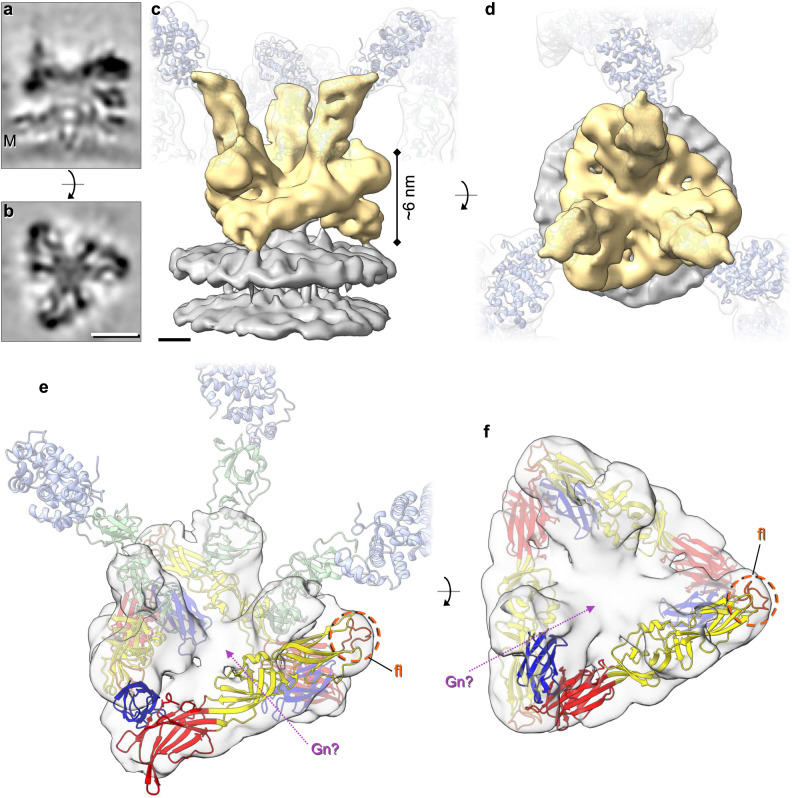
Fig. 2. STA of the floor region allows modelling of the BUNV fusion domain.
STA was performed as in Fig. 1, however aligning the floor region trimer (as opposed to the tripod). Over 16,000 subtomograms were aligned resulting in a ~ 13 Å resolution average (GS-FSC). a, b Sections through the electron density of the floor region average atop the viral membrane (M). c, d Isosurface rendering of the electron density (c side view, d top view) of the floor region (gold) atop the viral membrane (grey). Translucent tripods of the head-stalk (blue-green) regions have been added for orientation. e, f Modelling of the LACV fusion domain (residues 949–1344; domain I red, domain II yellow, domain III blue) in C3 symmetry within the BUNV floor region, revealing the location of the fusion loops (fl; orange) and remaining density that could be occupied by Gn (Gn?; pink arrow) (post-fusion structure pdb: 7A57). The location of the head (light blue) and stalk (light green) domains are indicated in (e) for orientation. Scale bars: a, b = 5 nm; c, d = 2 nm.

