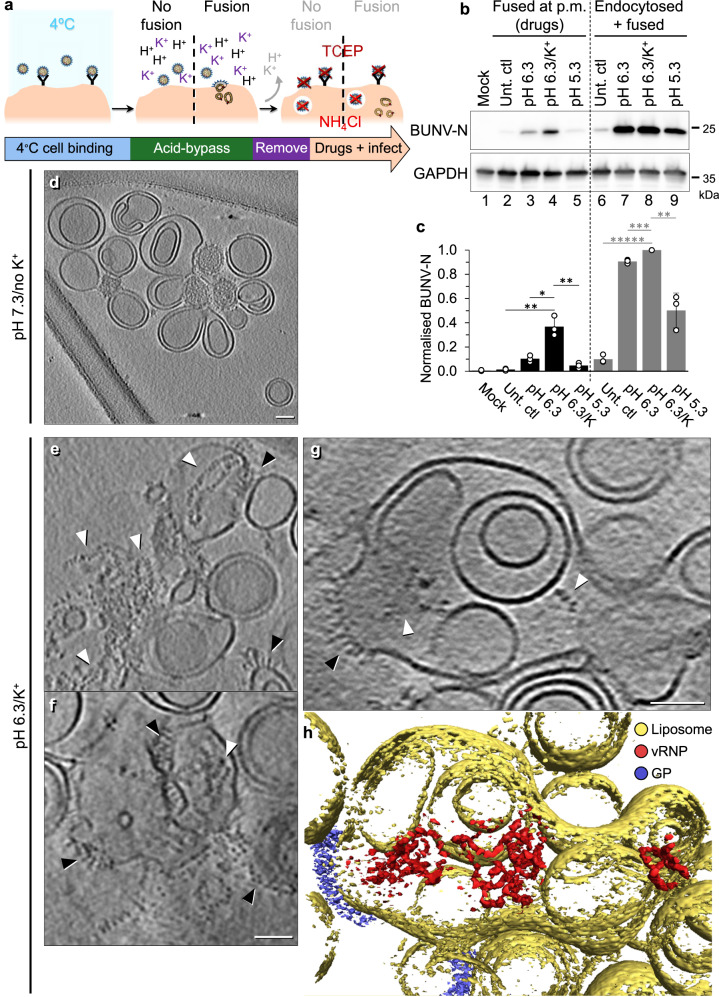
Fig. 6. pH 6.3/K+ induces fusion in the presence of a target membrane.
a Workflow of an acid-bypass assay. Virions are bound to A549 cells at 4 ˚C and fusion at the plasma membrane is attempted by acid-bypass at pH 6.3 (no K+), pH 6.3/K+, or pH 5.3 (no K+) for 2 mins at 37 ˚C. The addition of media for the 2 min ‘bypass’ was used for the untreated controls (‘Unt. ctl’). Bypass buffer is replaced with media with or without drugs to prevent endocytic entry (TCEP inactivates virions outside the cell; and NH4Cl inhibits endosomal acidification). Cells are lysed at 24 hpi and assessed by western blot using antibodies against BUNV-N (a marker of infection) or GAPDH (loading control). b Western blot of experiment in (a), where BUNV-N presence in lanes 2–5 (black) indicates successful fusion at the plasma membrane (p.m.) as drugs to inhibit further endocytic entry are present. In lanes 6–9 (grey) BUNV-N presence represents fusion at the plasma membrane and endocytic entry, as infection is allowed to proceed post-bypass (no drugs or harsh washing steps performed) (n = 3). c Densitometry of n = 3 western blots in (b), normalised to each loading control and then to the Unt. ctl (endocytosed+fused) (lane 6) (individual data points – white spheres). Error bars indicate mean ± standard deviation (SD), and significant difference determined using a one-way ANOVA comparing the significance of pH 6.3/K+ to each condition in the fused or endocytosed+fused (fused: Unt ctl P = 0.002, pH 6.3 P = 0.006, pH 5.3 P = 0.003. endocytosed+fused: Unt. ctl P = 1 × 10⁻⁶, pH 6.3 P = 0.0004, pH 5.3 P = 0.004). d–f Purified BUNV virions were mixed with liposomes for 2 hrs at 37 ˚C (as in Fig. 5) at d pH 7.3/no K+, or e–h pH 6.3/K+, and then samples were vitrified on cryo-EM grids (n = 3). Cryo-ET tilt series were collected and 3D tomographic reconstructions were calculated as with Fig. 1. In e–g, white arrowheads indicate vRNPs, and black arrowheads viral GPs attached to liposomes (low magnification tomograms in Supplementary Fig. 9b, c). Scale bars = 50 nm. h Tomogram segmentation of the pH 6.3/K+ tomogram in (g) was performed in Amira. Liposomes = yellow, vRNPs = red and GPs = blue (also in Supplementary Fig. 9c and Movie 4).

