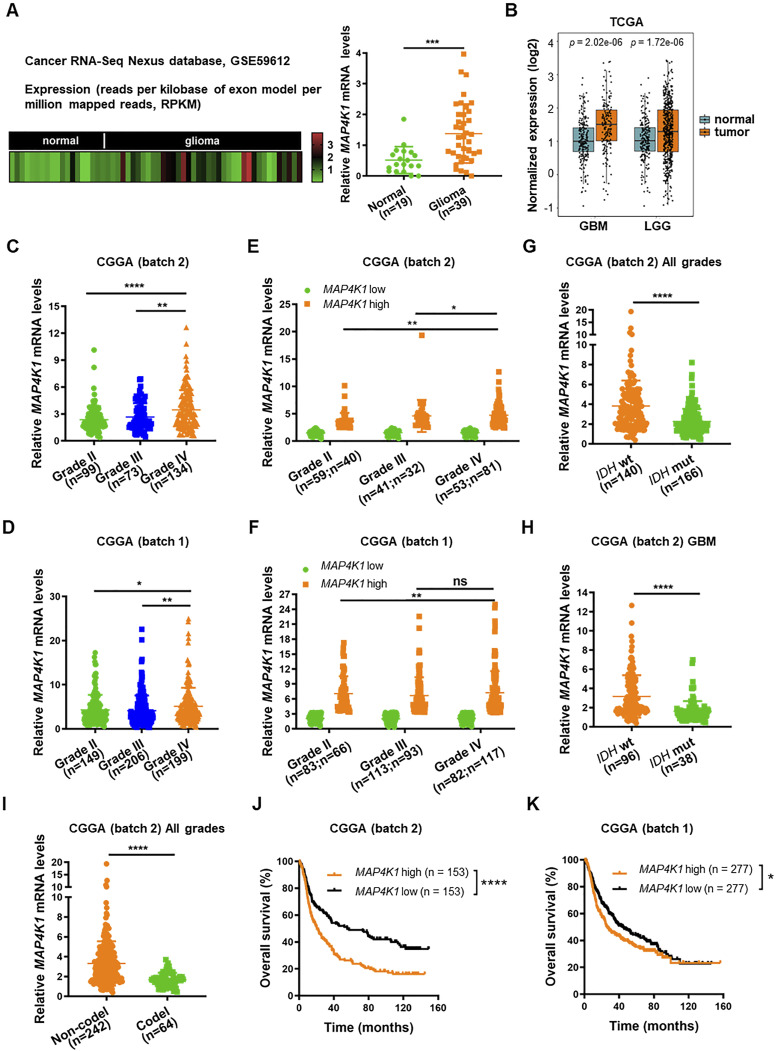
Figure 2. High MAP4K1 levels are correlated with poor prognosis in glioma patients.
(A) Heatmap (left) and statistical analysis (right) of MAP4K1 mRNA expression in human normal brain (n = 19) and glioma tissues (n = 39). The data were collected from the Cancer RNA-Seq Nexus platform (GSE59612). Data are represented as single data points and mean ± SD. ***P < 0.001 (t test). (B) Analysis of MAP4K1 mRNA levels in normal cerebral cortex samples (n = 207), glioblastoma multiforme (n = 166), and low-grade gliomas (n = 523). The data were from The Cancer Genome Atlas. Data are represented as single data points and mean ± SD (t test). (C, D) MAP4K1 mRNA expression in different pathological grades (II–IV). The data were from batch 2 ((C), n = 306) and batch 1 ((D), n = 554) of the Chinese Glioma Genome Atlas (CGGA). Data are represented as single data points and mean ± SD. *P < 0.05, **P < 0.01, ****P < 0.0001 (one-way ANOVA). (E, F) Cases of high and low MAP4K1 mRNA levels in different pathological grades (II–IV). The data were from CGGA batch 2 ((E), grade II, low n = 59, high n = 40; grade III, low n = 41, high n = 32; grade IV, low n = 53, high n = 81) and batch 1 ((F), grade II, low n = 83, high n = 66; grade III, low n = 113, high n = 93; grade IV, low n = 82, high n = 117). Data are represented as single data points and mean ± SD. ns, no significance, *P < 0.05, **P < 0.01 (χ2 test). (G, H, I) Analysis of MAP4K1 mRNA levels according to isocitrate dehydrogenase gene (IDH) phenotypes, WT or mutation (mut), in all grades of gliomas ((G), n = 306) and glioblastoma multiforme ((H), n = 134), and 1p/19q status (codeletion or non-codeletion) in all grades of gliomas ((I), n = 306). The data were from CGGA (batch 2). Data are represented as single data points and mean ± SD. ****P < 0.0001 (t test). (J, K) Overall survival analysis of MAP4K1-low and -high groups of glioma patients. The data were from CGGA batch 2 ((J), n = 306) and batch 1 ((K), n = 554). *P < 0.05, ****P < 0.0001 (Kaplan‒Meier method, log-rank test). (E, F, J, K) The samples were categorized into MAP4K1-low and -high groups using median expression levels of MAP4K1 mRNA as the cutoff value in (E, F, J, K).

