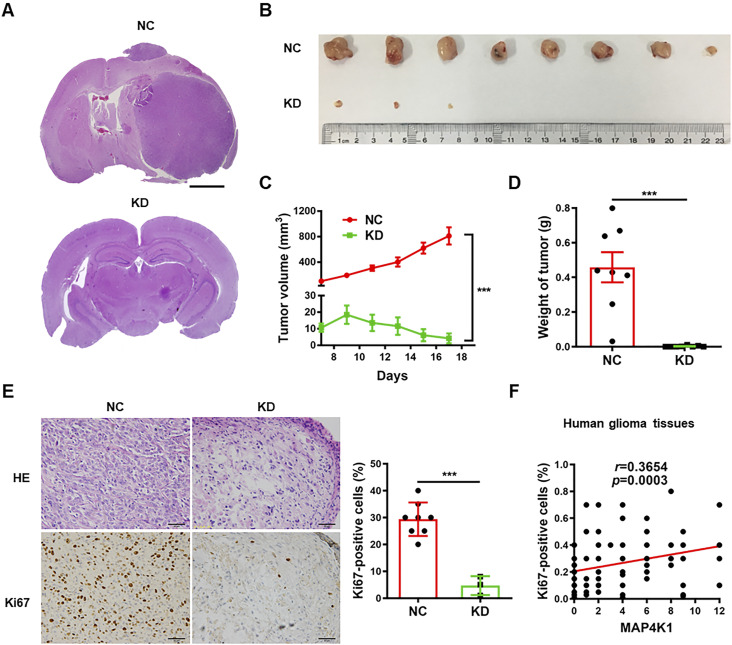
Figure 4. MAP4K1 of glioblastoma multiforme cells promotes glioma growth in vivo.
(A) Representative hematoxylin and eosin (HE) staining images of mouse intracranial gliomas. Stable MAP4K1-knockdown (KD) U87 cells or negative control (NC) cells were orthotopically implanted into athymic nude mice (n = 4). Scale bar, 0.8 mm. (B, C, D, E) Gross images of tumors (B), tumor growth curve (C), tumor weight (D), and HE staining/Ki67 immunohistochemistry staining (E) in mouse subcutaneous gliomas. Scale bar, 50 μm. Stable MAP4K1-KD U87 cells or NC cells were subcutaneously implanted into athymic nude mice (n = 8). (C, D) Data are represented as mean ± SEM (two-way ANOVA in (C) and Mann‒Whitney U test in (D)). (E) Data are represented as single data points and mean ± SD (t tests in (E)) ***P < 0.001. (F) Correlation analysis of MAP4K1 immunoreactivity scores with proliferation rates (% Ki67-positive cells) in human glioma tissues (n = 97). Correlation analysis was performed by Spearman correlation.

