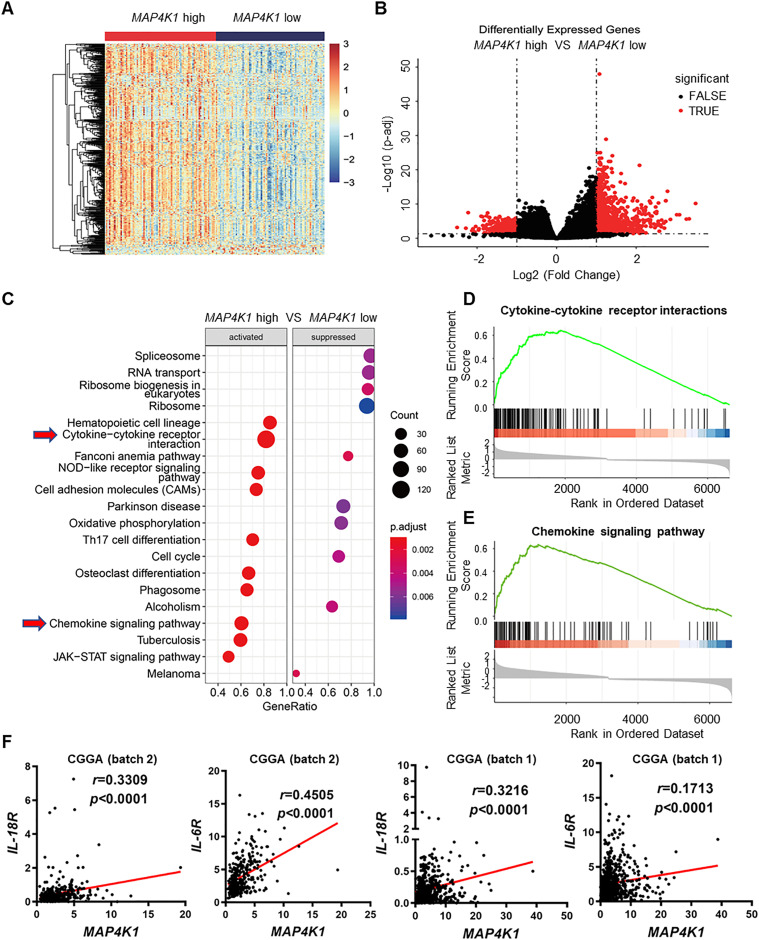
Figure 6. MAP4K1 is correlated with cytokine‒cytokine receptor interactions and chemokine signaling pathways in human gliomas.
(A, B) Heatmap (A) and volcano plot (B) show differentially expressed genes in MAP4K1-high and -low human glioblastoma multiforme. The data were from The Cancer Genome Atlas-glioblastoma multiforme dataset (n = 166) and categorized into high- and low-expression groups using median expression levels of MAP4K1 mRNA as the cutoff value. (C, D, E) Gene Set Enrichment Analysis pathway enrichment analysis based on differentially expressed genes in MAP4K1-high and -low groups (C). (D) MAP4K1 is positively correlated with cytokine–cytokine receptor interactions. P = 0.000103, NES = 2.872095, Q-value = 0.000550. (E) MAP4K1 is positively correlated with chemokine signaling pathways. P = 0.000106, NES = 2.707719, Q-value = 0.000551. (F) Correlation analysis of MAP4K1 mRNA levels with IL-18R and IL-6R levels. The data were from batch 2 and batch 1 of the Chinese Glioma Genome Atlas (batch 2, n = 325, batch 1, n = 693, r and P-values are indicated).

