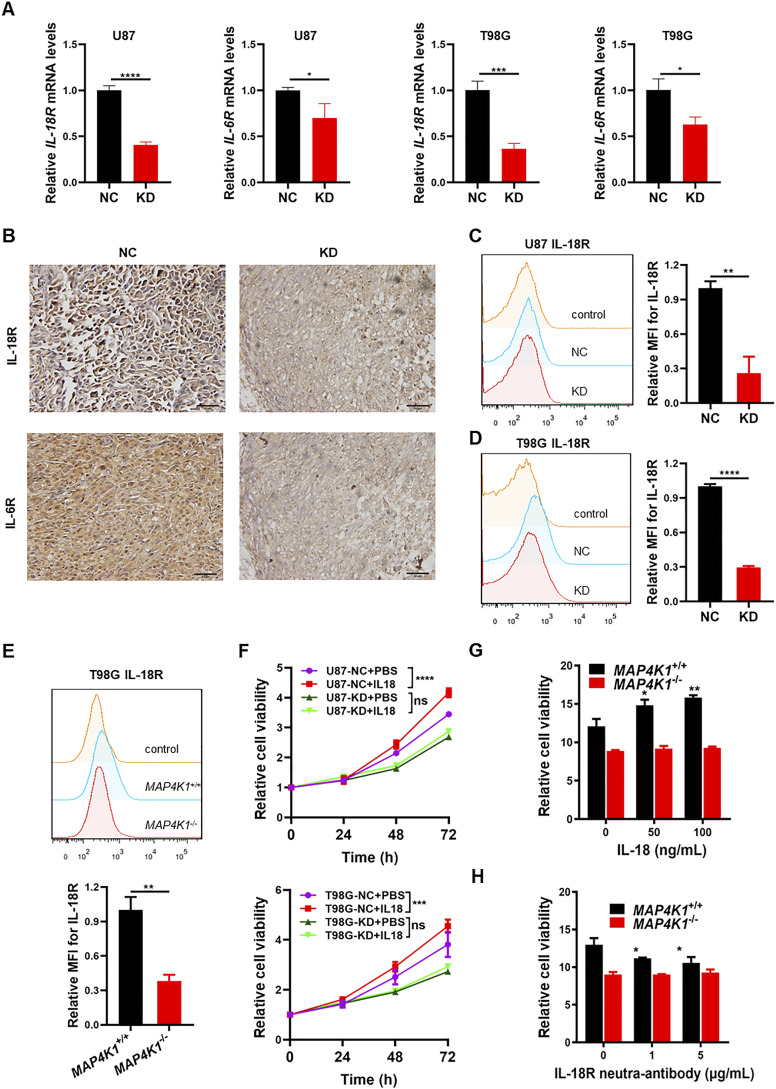
Figure 7. MAP4K1 enhances the expression of IL-18R and IL-6R and promotes the proliferation of glioblastoma multiforme cells.
(A) Real-time quantitative PCR analyses of IL-18R and IL-6R mRNA levels in MAP4K1-knockdown (KD) U87 and T98G cells and their negative control (NC) cells (n = 9, the data were from three independent experiments). (B) IL-18R and IL-6R protein expression detected by immunohistochemistry in mouse glioma tissues constructed by MAP4K1-KD (n = 3) and NC (n = 8) of U87 cells. Scale bar, 50 μm. (C, D, E) Respective flow cytometry histograms and relative levels of the mean fluorescence intensity for membrane-bound IL-18R in MAP4K1-KD or knockout (MAP4K1−/−) U87, T98G, and respective control cells 48 h after seeding (n = 3, the data were from an independent experiment, and the same experiment was repeated three times). (F, G, H) CCK8 assay of cell viability. The data were from three independent experiments. (F) MAP4K1-KD and NC cells were stimulated with IL-18 (100 ng/ml) and detected at different time points (24, 48, and 72 h) (n = 11). (G) MAP4K1−/− and MAP4K1+/+ T98G cells were treated with different doses of IL-18 (0, 50, and 100 ng/ml). (H) IL-18R was blocked with a neutralizing antibody (0, 1, 5 μg/ml). (G, H) Cell viability was determined at 96 h (n = 15 in (G, H)). In (A, C, D, E, F, G, H), data are presented as the mean ± SD. In (A, C, D, E), the data were analyzed by t tests. In (F, G, H), data were analyzed by two-way ANOVA. ns, not significant, *P < 0.05, **P < 0.01, ***P < 0.001, ****P < 0.0001.

