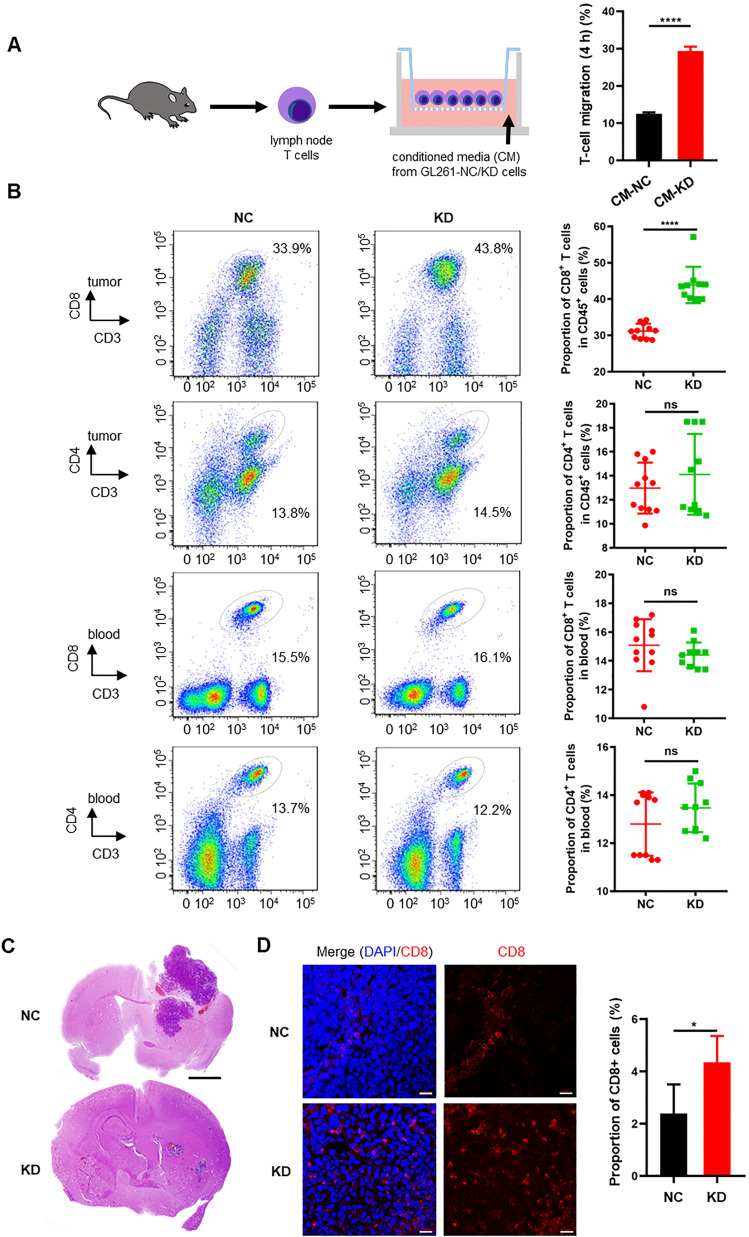
Figure 9. MAP4K1 down-regulation increases the infiltration of CD8+ T cells in tumor tissues of subcutaneous and intracranial glioma models.
(A) The migration of T cells was detected by chemotaxis experiments 4 h after treatment with conditioned medium (CM) from MAP4K1-knockdown (KD) and negative control (NC) GL261 cells. Data are represented as the mean ± SD (n = 3, the data were from an independent experiment, and this experiment was repeated three times). ****P < 0.0001 (t test). (B) Flow cytometry analysis of CD8+ and CD4+ T-cell proportions of CD45+ cells in the tumor tissues and peripheral blood of mouse subcutaneous glioma models constructed with MAP4K1-KD GL261 cells (n = 10) and NC cells (n = 11). Data are represented as the mean ± SD. ns, no significance, ****P < 0.0001 (t test). (C) Representative hematoxylin and eosin (HE) staining images of tumors from the intracranial glioma models constructed with MAP4K1-KD GL261 and NC cells (n = 4). Scale bar, 0.8 mm. (D) Proportions of CD8+ T-cell infiltration were measured by immunofluorescence in intracranial gliomas constructed with MAP4K1-KD GL261 and NC cells (n = 4). Scale bar, 20 μm. Data are represented as the mean ± SD. *P < 0.05 (t test).

