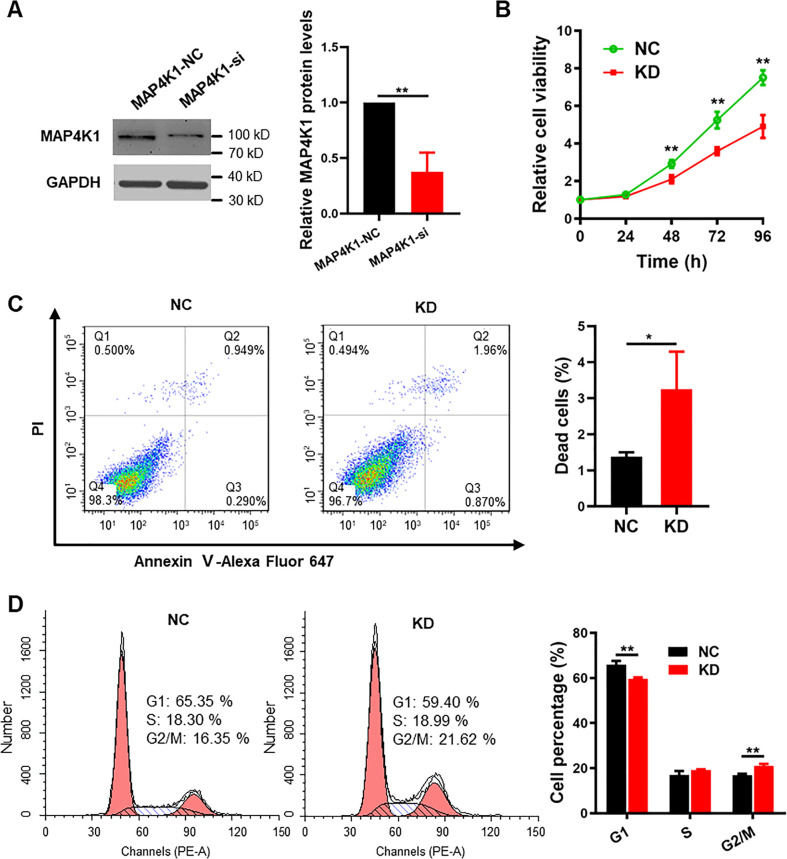
Figure S2. MAP4K1 promotes proliferation and inhibits apoptosis in patient-derived glioblastoma G1 cells.
(A) Representative images of immunoblot analysis and statistical results of MAP4K1 siRNA knockdown efficiency in G1 cells. Data are represented as the mean ± SD (n = 3, t test), **P < 0.01. (B) Cellular viability detected by CCK8 (24, 48, 72, and 96 h) in G1 cells transduced with either a nontargeting control siRNA (NC) or MAP4K1-targeting siRNA (KD). Data are represented as the mean ± SD (n = 15, the data were from three independent experiments), **P < 0.01 (two-way ANOVA). (C, D) Cell death after 48 h of seeding (C) and cell cycle distribution after 72 h of seeding (D) were analyzed by flow cytometry in MAP4K1-KD and control G1 cells. (C, D) Data are represented as the mean ± SD (n = 3, the data were from an independent experiment, and this experiment was repeated three times), *P < 0.05 (t test in (C)), **P < 0.01 (two-way ANOVA in (D)).
Source data are available for this figure.

