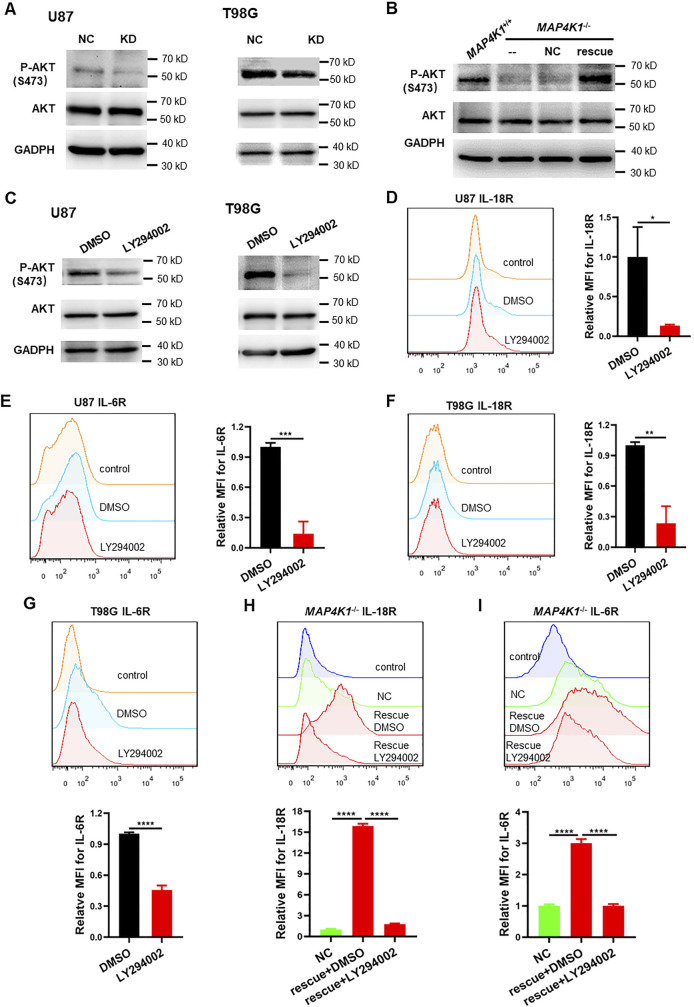
Figure S5. MAP4K1 regulates IL-18R and IL-6R expression by the PI3K-AKT pathway.
(A) Representative immunoblot graphs of P-AKT (S473) and AKT levels in MAP4K1-knockdown (KD) U87 and T98G cells and control cells (NC) (n = 3). (B) Representative immunoblot graphs of P-AKT (S473) and AKT levels in MAP4K1 rescue T98G cells and control cells (NC) (n = 3). (C) Representative immunoblot graphs of P-AKT (S473) and AKT levels after treatment with the PI3K inhibitor LY294002 (25 μM) or vehicle DMSO for 48 h in U87 and T98G cells (n = 3). (D, E, F, G) Respective flow cytometry histograms and relative levels of the mean fluorescence intensity of membrane-bound IL-18R and IL-6R after treatment with the PI3K inhibitor LY294002 (25 μM) or vehicle DMSO for 72 h in U87 and T98G cells. (H, I) Respective flow cytometry histograms and relative levels of the mean fluorescence intensity of membrane-bound IL-18R (H) and IL-6R (I) after treatment with LY294002 (25 μM) or vehicle DMSO for 72 h in MAP4K1 rescue T98G cells. (D, E, F, G, H, I) Data are represented as the mean ± SD (n = 3, the data were from an independent experiment, and this experiment was repeated three times), *P < 0.05, **P < 0.01, ***P < 0.001, ****P < 0.0001 (t test in (D, E, F, G), one-way ANOVA in (H, I)).
Source data are available for this figure.

