
FIGURE 1.
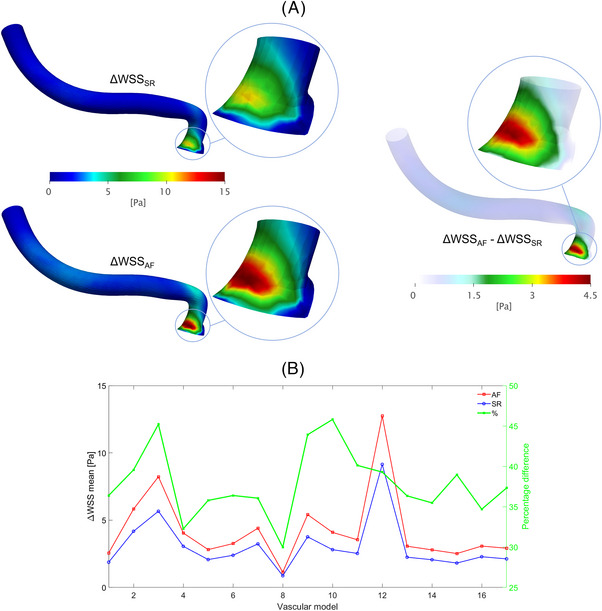
(A) CFD models of a representative LSA displaying local Δ𝑊𝑆𝑆 values (left panel: SR and AF; right panel: AF−SR relative difference) along the entire 3D segmentation and in the ROI with n = 2 (zoomed inlets); (B) Δ𝑊𝑆𝑆 at the proximal portion (ROI2) of each 3D anatomy in the two rhythm conditions (AF and SR) and corresponding relative difference (using SR values as baseline).