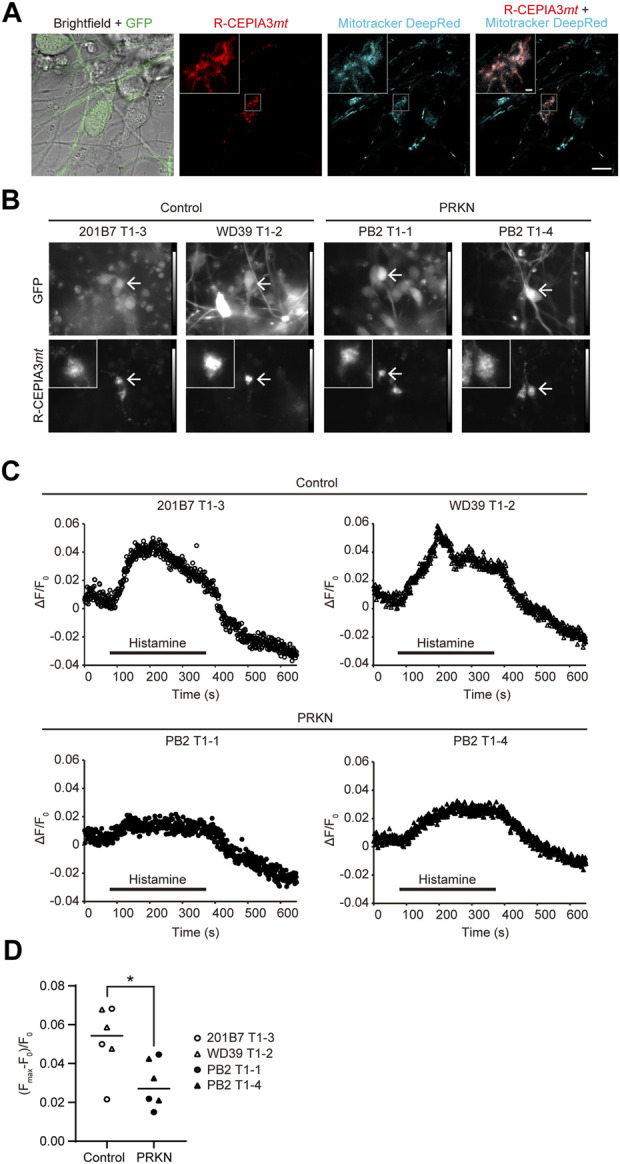
FIGURE 4.

Mitochondrial Ca2+ imaging in GFP-positive dopaminergic neurons derived from TH-GFP iPSCs. (A) Live cell images of R-CEPIA3mt-expressing WD39 T1-2 dopaminergic neurons stained with Mitotracker DeepRed. Scale bar, 10 µm. The boxed areas are enlarged to show the cytoplasmic area of GFP-positive R-CEPIA3mt-expressing dopaminergic neurons. Scale bar of the enlarged images, 1 µm.(B) Representative GFP and R-CEPIA3mt images of the differentiated cells derived from control and PRKN-mutant patient TH-GFP iPSCs before mitochondrial Ca2+ measurement. Arrows indicate GFP-positive R-CEPIA3mt-expressing dopaminergic neurons. “PRKN” represents PRKN-mutant patient. The boxed areas are enlarged to show the cytoplasmic area of GFP-positive R-CEPIA3mt-expressing dopaminergic neurons. (C) Representative time course of the ratio of the change in R-CEPIA3mt fluorescence intensity after histamine treatment in GFP-positive dopaminergic neurons derived from TH-GFP iPSCs. ΔF/F0 = (fluorescence intensity—minimum fluorescence intensity before stimulation)/minimum fluorescence intensity before stimulation. “PRKN” represents PRKN-mutant patient. (D) Quantitative analysis of maximum Ca2+ flux in control and PRKN-mutant dopaminergic neurons derived from TH-GFP iPSCs. (Fmax–F0)/F0 = (maximum fluorescence intensity during stimulation—minimum fluorescence intensity before stimulation)/minimum fluorescence intensity before stimulation. The quantitation was performed for six control dopaminergic neurons and six PRKN-mutant dopaminergic neurons, with a ROI surrounding the cytoplasmic area. “PRKN” represents PRKN-mutant patient. Statistical significance was evaluated using the unpaired t-test. Horizontal lines indicate median values. *p < 0.05.
