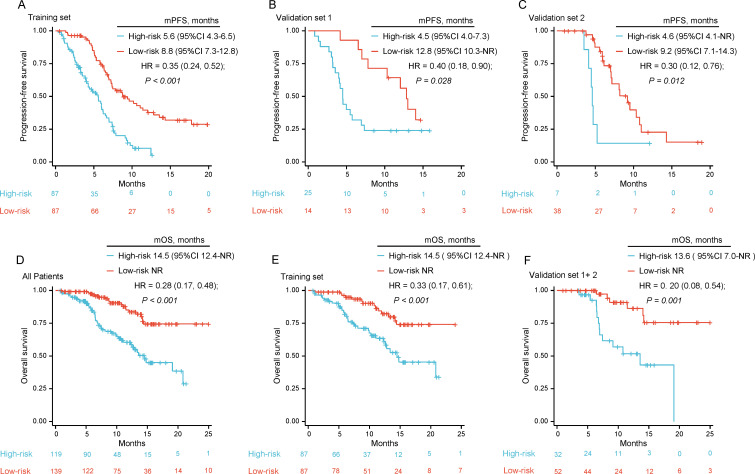
Figure 6.
Kaplan-Meier analysis in the cohorts. (A–C) K-M curves of PFS in (A) the training set, (B) validation set 1 and (C) validation set 2 stratified as low-progression-risk and high-progression-risk using the integrated model. (D–F) K-M curves of OS in (D) all patients, (E) training set and (F) validation set stratified as low-progression-risk and high-progression-risk using the integrated model. K-M, Kaplan-Meier; mOS, median OS; mPFS, median PFS; OS, overall survival; PFS, progression-free survival.

