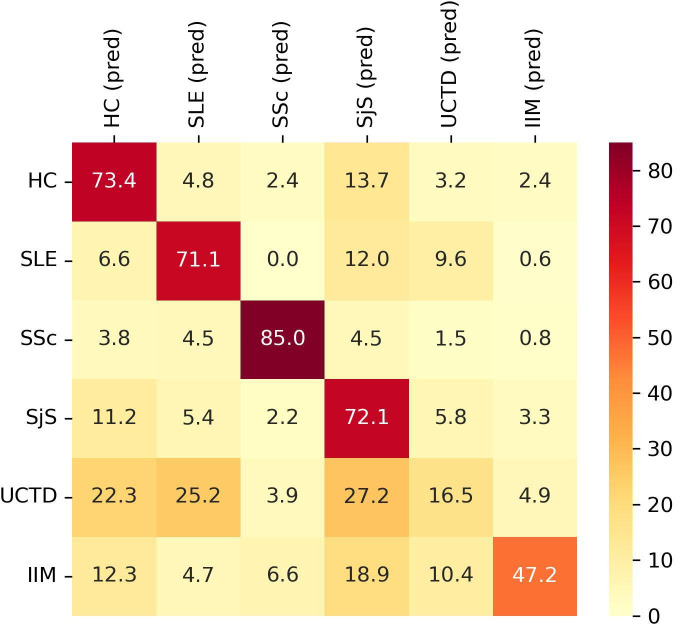
Figure 1.
Classification performance of XGBoost model for each group of subjects according to autoantibodies titres. Y axis shows the group subjects belong to. X axis shows the predicted (pred) classification. Data are shown as percentage. HC, healthy controls; IIM, idiopathic inflammatory myopathies; SLE, systemic lupus erythematosus; SjS, Sjogren’s syndrome; SSc, systemic sclerosis; UCTD, undifferentiated connective tissue disease.

