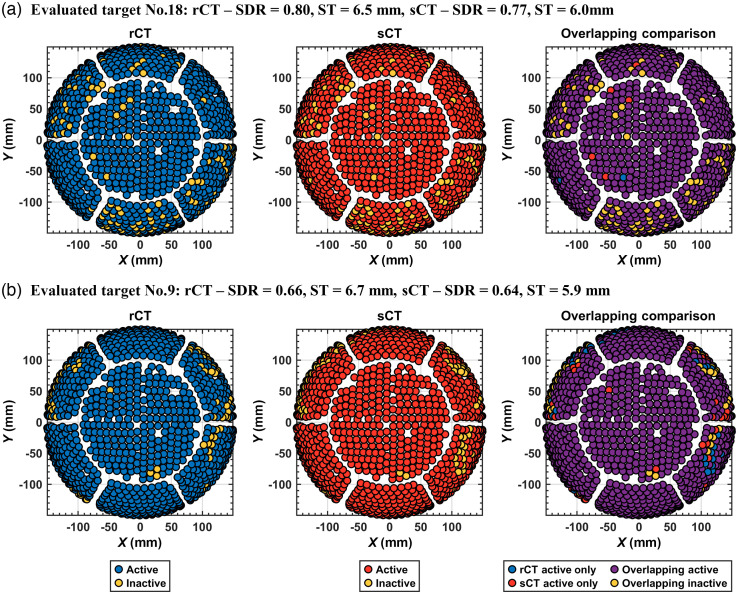
Fig. 7.
Active elements were similar between rCT and sCT. Visual comparisons are shown for two representative cases to evaluate overlapping active and inactive elements between rCT and sCT. Plots are color coded, showing the distribution of active and inactive elements of the 990 element hemispherical array for the (a) most overlapping case with 98.9% of the active and inactive elements overlapping between rCT and sCT, and the (b) least overlapping case with 92.8% overlapping. From left to right, elements for the rCT skull, sCT skull, and then compared between rCT and sCT for the overlapping and non-overlapping elements. The case numbers noted in the titles of each subplot correspond with the bar plot in Fig 6.

