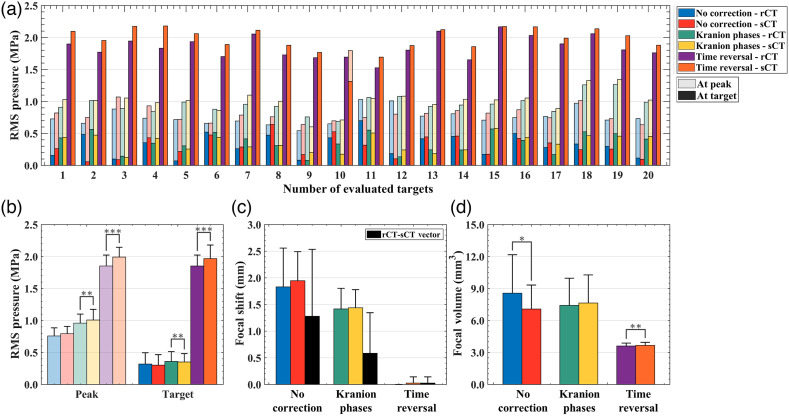
Fig. 8.
(a) Acoustic simulation results from k-Wave. For each evaluated target, the peak intracranial RMS pressure (transparent bars) and the pressure at the target (solid bars) are shown for rCT and sCT, grouped by phase correction type. (b)–(d) A group summary of all 20 test cases are shown for RMS pressure, focal shift, and focal volume.

