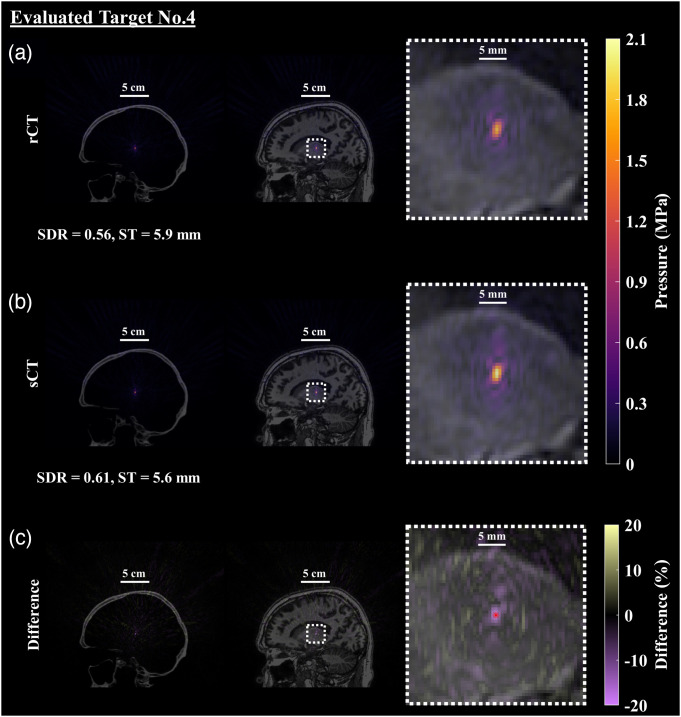
Fig. 9.
Simulated pressure field after applying phases calculated from time reversal. An example of the resultant pressure field with TR-corrected phases targeting the left Vim is shown (evaluated target No. 4). (a) The first row contains the pressure field simulated with the rCT skull volume, overlaid on the CT and MR images and enlarged in the final column to better see the focal shape and size. (b) Similarly, the sCT skull and simulated acoustic field is presented with similar overlays. (c) The percent difference of the pressure fields between rCT and sCT was calculated using the rCT peak pressure as the ground truth and is presented in the final row, denoting the intended location with the red dot. The evaluated target was selected as the representative case as it had the largest percent different at the spatial peak location. Qualitatively and quantitatively the spatial extent of the foci are very similar between the rCT and sCT results, with the main difference identified as the maximum pressure.

