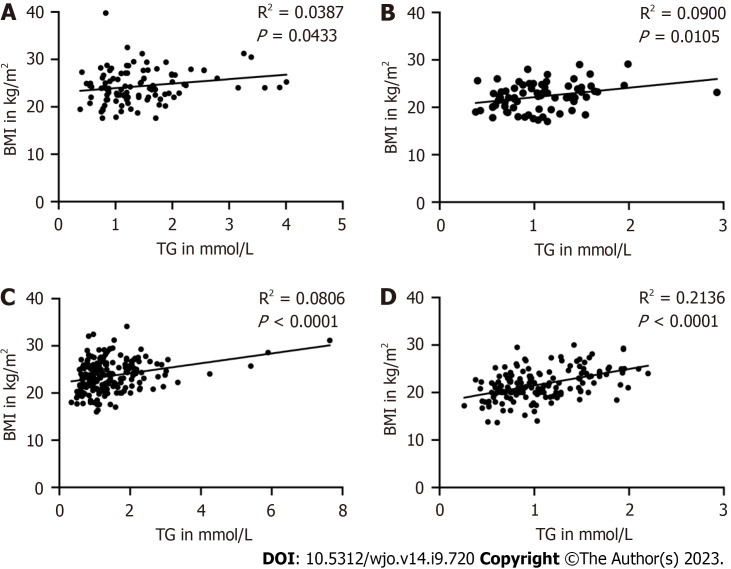
Figure 3.
The correlation between body mass index and triglyceride in male and female patients. A: Presented the group of 65-79 years old male patients; n = 106; B: Presented the group of ≥ 80 years old male patients; n = 72; C: Presented the group of 65-79 years old female patients; n = 188; D: Presented the group of ≥ 80 years old female patients; n = 154. P < 0.05 as a different significance level. BMI: Body mass index; TG: Triglyceride.

