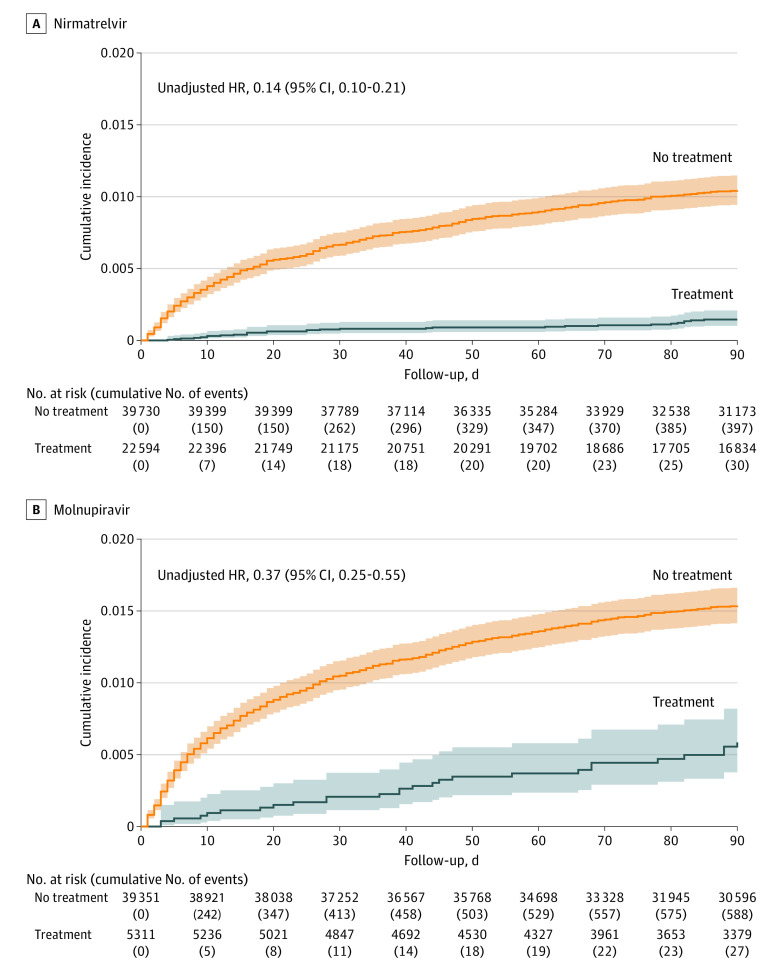
Figure 2. Cumulative Incidence of Death in Patients Infected With Omicron, by Treatment.
Graphs show incidence of death for patients who received nirmatrelvir (A) and molnupiravir (B) compared with those who were eligible for each treatment but did not receive any treatment. The solid curves show the Kaplan-Meier estimates for the cumulative incidence of death over 90 days after diagnosis of COVID-19. The shaded areas indicate the 95% CIs. The unadjusted hazard ratios (HRs) and 95% CIs are also shown.

