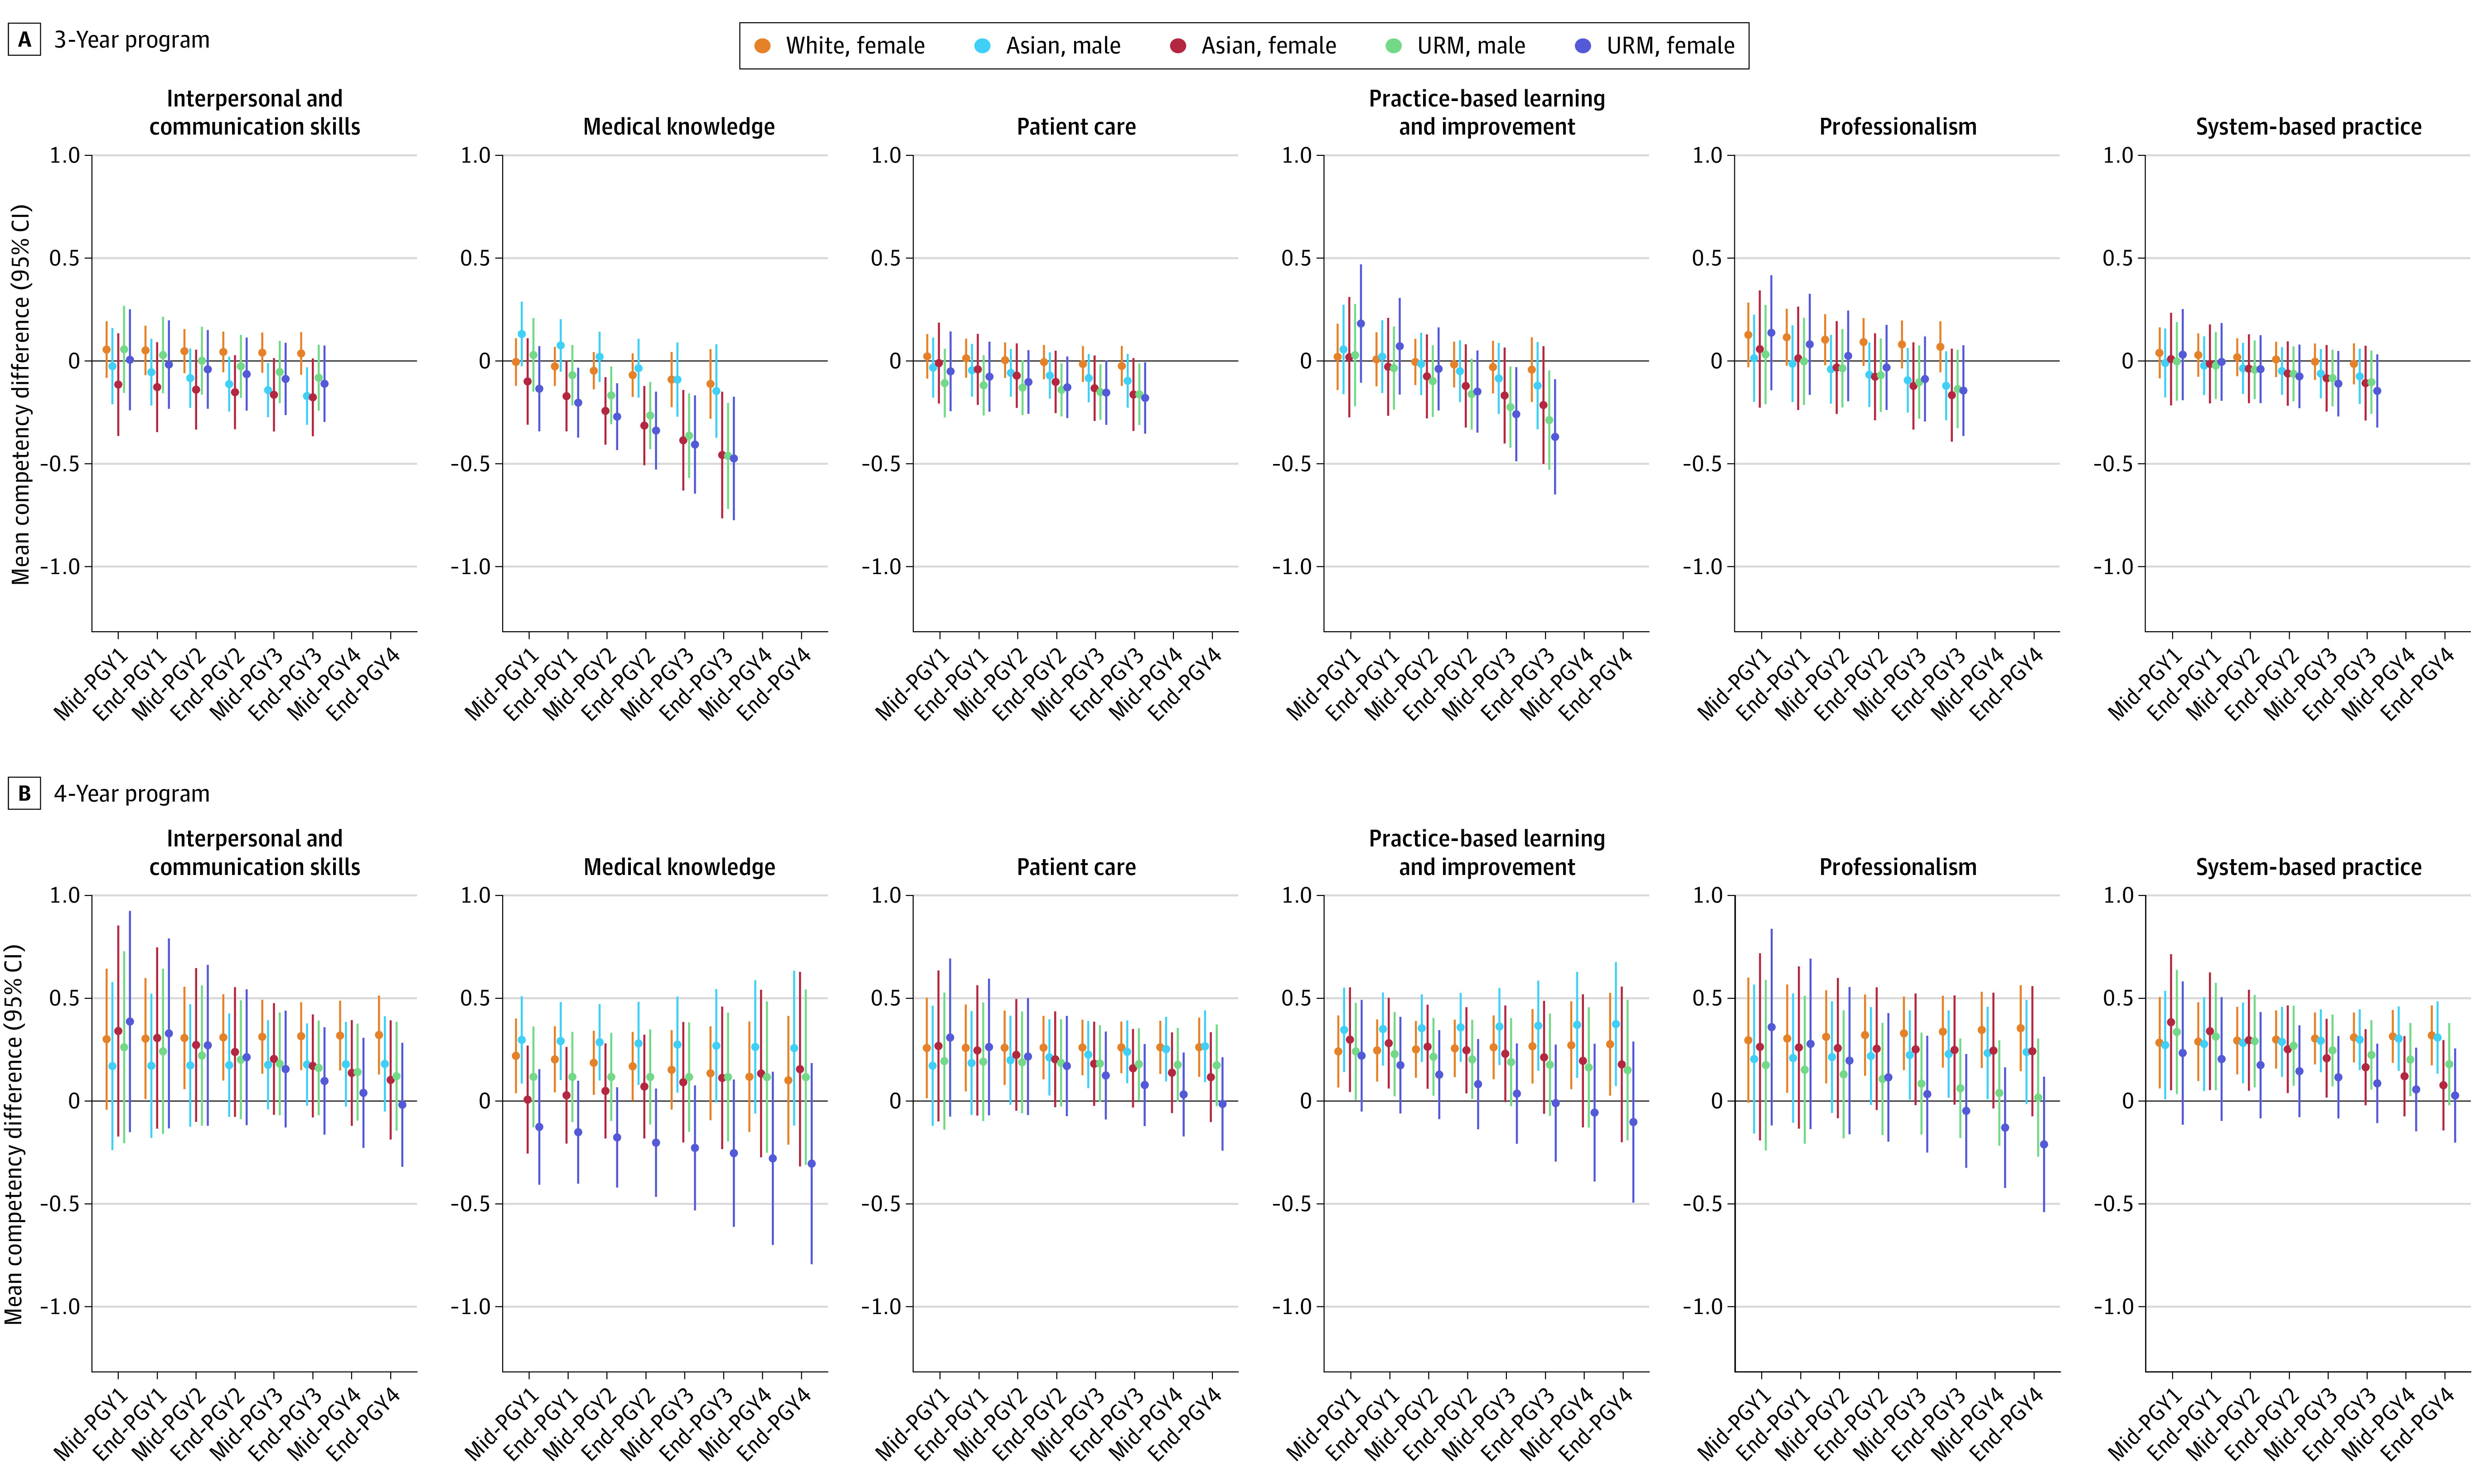
Figure 3. Intersectional Disparities in Competency Scores by Ethnoracial Group and Sex Cross-Strata.

A, Linear contrasts and corresponding 95% CIs comparing each ethnoracial group and sex cross-strata to White male residents in 3-y programs. B, 4-y programs for each postgraduate year (PGY) time point. Mixed-effects models included a random intercept for individual residents and programs as well as a random slope for time. The model also adjusted for United States Medical Licensing Examination Step 2 Clinical Knowledge Step 2 CK scores as fixed effects. URM indicates underrepresented in medicine.
