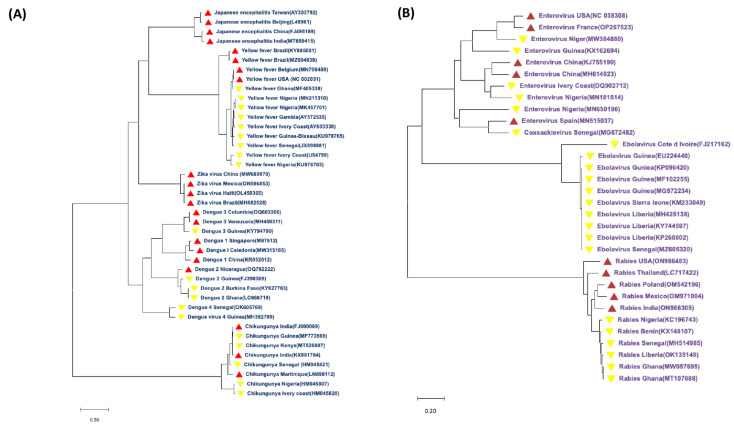
Figure 2.
Phylogenetic trees showing the relatedness of arthropod-borne (A) and non-arthropod-borne (B) viral encephalitides in West Africa and other countries. Whole genome sequences of the viruses were downloaded from the GenBank across West Africa (yellow triangle) and other countries (red triangle). Countries with partial sequences were not considered, hence excluding several countries from the tree. FASTA files of all the sequences were downloaded and aligned using BioEdit 7.2 software. The phylogenetic tree was constructed using MEGA 11 software. The evolutionary history was inferred using the maximum likelihood method and Tamura–Nei model [40]. For Figure 2A, the tree with the highest log likelihood (−151,004.45) is shown. Initial tree(s) for the heuristic search were obtained automatically by applying the neighbor-join [41] and BioNJ algorithms to a matrix of pairwise distances estimated using the Tamura–Nei model, and then selecting the topology with superior log likelihood value. The tree is drawn to scale, with branch lengths measured in the number of substitutions per site. This analysis involved 41 nucleotide sequences. There was a total of 12,453 positions in the final dataset. Data garnered from the study published by the authors of [38]. For Figure 2B, the tree with the highest log likelihood (−165,598.54) is shown. This analysis involved 32 nucleotide sequences. There was a total of 19,286 positions in the final dataset. Evolutionary analyses were conducted in MEGA11 [42].

