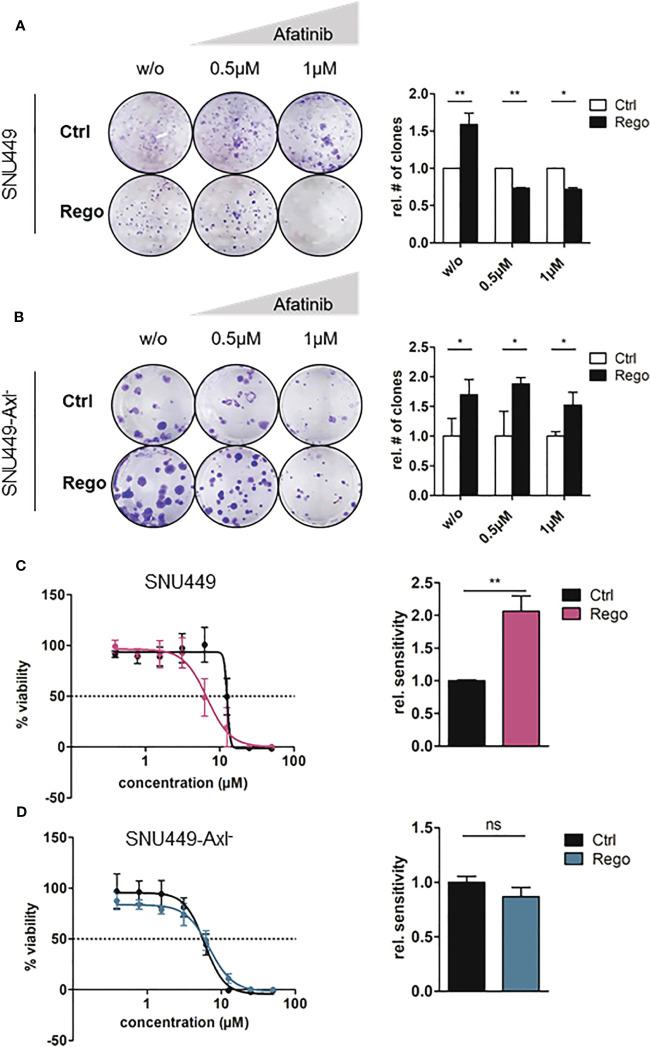
Figure 4.
Resistance to Rego sensitizes Axl-expressing cells towards Afatinib. (A, B) Clonogenic growth behavior of control (naïve) and Rego-resistant SNU449 cells untreated (w/o) or treated with increasing concentrations of Afatinib in the Axl-proficient (A) and Axl-deficient background (B). Bar charts depict the quantification of colonies relative to control (right panels). (C, D) Dose-response curves of control and Rego-resistant SNU449 cells against Afatinib in the Axl-positive (C) and Axl-negative background (D). Bar charts show sensitivity (IC50) against Afatinib relative to controls (C, D). (A–D) Sensitivities of controls were set to the value of 1. Data are expressed as mean +/- SD. ns: p > 0.05; *p ≤ 0.05; **p ≤ 0.01; Rego, Regorafenib.

