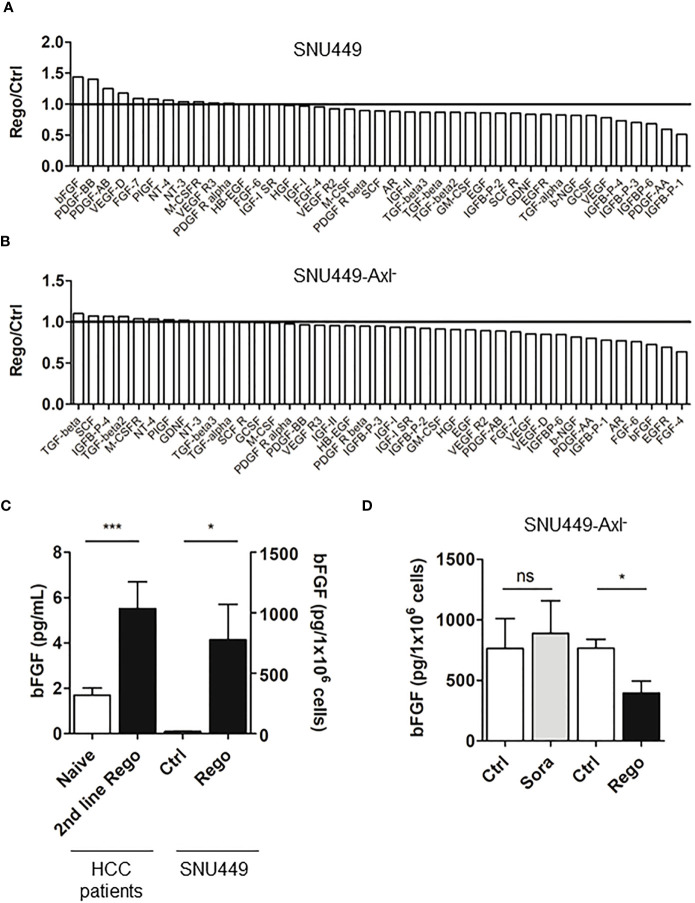
Figure 6.
Resistance to Rego induces bFGF secretion. (A, B) Quantification of growth factor signals comparing control (ctrl, naïve) and Rego-resistant SNU449 cells in the Axl-proficient (A) and Axl-deficient background (B). Bar charts depicts relative abundance of growth factors to their respective naïve control. Black lines indicate unchanged growth factor levels (A, B). (C) Levels of bFGF in sera of naïve and 2nd line Rego-treated HCC patients and supernatants of control (white) and Rego-resistant SNU449 cells as determined by ELISA. (D) bFGF levels in supernatants of control (white) and Sora- and Rego-resistant SNU449-Axl- cells (grey, black) as determined by ELISA. Data are expressed as mean +/- SD. ns: p > 0.05; *p < 0.05. ***p ≤ 0.001. Rego, Regorafenib; Sora, Sorafenib.

